
BT Group plc
Annual Report
2019
BT Group plc Annual Report 2019

N on-Financial Reporting Information Statement
Our integrated approach to reporting means that the requirements
of the Non-Financial Reporting Directive are addressed throughout
the Strategic report. For ease of reference, information pertaining to
each of the matters addressed by the new regulation can be found
on the following pages: Human rights (page 25 ); Our people (page
22 ); Social (page 24 ); Environmental (page 26 ); Anti-corruption and
bribery (page 32 ).
At a glance
We help build better digital
lives and businesses, and
support the UK as a world-
class digital economy.
Our purpose
We use the power of
communications to
make a better world.
… focused on
sustainable growth…
p 30
p 34
… supported by a strategy
with three refreshed
priorities …
O ur strategy
• Diff erentiated customer experience.
• Best converged network.
• Simplifi ed, lean and agile business.
p 14
… and being a
responsible business …
Non-fi nancial
performance
Our performance
as a sustainable
and responsible
business.
Governance
Corporate
Governance
is critical to
delivering our
strategy.
p 32
p 55
… to achieve
our goal.
Our goal
Drive sustainable
growth in value.
… a strong culture with
shared values …
People and
culture
Making BT
a brilliant
place to work.
Values
• Personal
• Simple
• Brilliant
Key performance
indicators
Group
performance
In a rapidly
changing
industry …
Market context
We understand and respond
to market opportunities and
challenges.
p
8
… we have a clear
business model …
Business model
We provide customers with
communications and connectivity
services.
p 12
p 22
p 22

Contents
Strategic report
A message from our Chairman 2
A message from our Chief Executive 3
About BT 4
Executive Committee 6
Market context 8
Our business model 12
Our strategy 14
Strategic progress 16
Our stakeholders 22
Our key performance indicators 30
Group performance 34
A message from the Openreach
Chairman 42
Our approach to risk management 44
Our principal risks and uncertainties 46
Our viability statement 54
Governance 55
Financial statements 100
Additional information 185
1
BT Group plc Annual Report 2019 Strategic report
Governance
Financial statements
Additional information
Look out for these t hroughout
the report:
Reference to another page in the report
Reference to further reading online
Critical accounting estimates
and key judgements
More information
btplc.com
bt.com/annualreport
Digital impact and sustainability report
btplc .com/ digitalimpactandsustainability
This Strategic report was approved
by the Board on 8 May 2019.
By order of the Board
Rachel Canham
Company Secretary & General Counsel, Governance
8 May 2019
Please see the cautionary statement regarding
forward-looking statements on page 190 .
Pages 1 to 54 form the Strategic report. It includes
Our business model, Strategic progress, Group
performance and Our principal risks and uncertainties.
The Governance section on pages 55 to 99 forms the
Report of the Directors.

2
BT Group plc Annual Report 2019
I am pleased to report that we have
over the last year overcome numerous
challenges to deliver a set of solid fi nancial
results. More importantly, we have made
good progress on delivering our strategy,
focused around diff erentiated customer
experience, our best converged network,
and creating a simple, lean and agile
business. We have continued to deliver the
vital connectivity and services that families
and businesses in the UK and beyond need
to fl ourish.
BT has a critical role at the heart of the
UK’s digital future, and our substantial
investments in fi xed and mobile networks
make an essential contribution. The new
converged propositions we launched this
year are the start of the services of the
future. Within BT we are strengthening
our focus on enabling the digital skills of
our people, customers and communities,
thereby further contributing to the UK’s
digital economy.
We will be launching 5G in 16 cities this
year. We will also increase our investment
in fi bre-to-the-premises (FTTP), while
working with the Government and Ofcom
to create the right conditions to go further
and faster. We are pleased with our closer
relationships with these key stakeholders
as we unite around the common goal of
building the UK’s FTTP network.
In May 2018 we agreed the 2017 triennial
funding valuation for the BT Pension
Scheme. This allows us to move ahead with
greater fi nancial certainty.
Our solid profi t and normalised free cash
fl ow not only provide the foundation for
investment in our strategic priorities but
allow us to reward shareholders. We are
paying the same dividend as last year at
15.4 p per share. We also expect to hold
the dividend unchanged in respect of the
2019/20 fi nancial year given our outlook
for earnings and cash fl ow. The Board
remains committed to our dividend policy,
which is to maintain or grow the dividend
each year whilst taking into consideration
a number of factors including underlying
medium term earnings expectations and
levels of business reinvestment ( which
would include the consideration of
accelerated FTTP investment).
I am satisfi ed we are making progress
at pace. The coming year will see BT
continuing its transformation to become
a simplifi ed, lean and agile business.
Across the business I see a commitment to
streamlining processes, governance and
organisational structures; simplifying lines
of responsibility; and helping people make
better decisions.
As a Board, we are leading by example.
I recently carried out a review of the
structure, composition and operation
of our committees to speed up decision
making and improve overall governance.
As a result, we have reduced the number
of board committees and clarifi ed lines of
responsibility. Further details are described
in the Governance report on page 55 .
I would like to welcome non-executive
directors Matthew Key and Allison Kirkby
to the Board. They both bring valuable
experience of the communications and
technology sectors.
Gavin Patterson stepped down as chief
executive at the end of January and I would
like to thank him for his contribution to the
business over his 1 5 years with the company.
He led BT with vision and dedication through
a challenging time and started the necessary
process of transforming our business for the
demands of modern society. We wish him
well for the future.
I would like to extend a warm welcome
to our new chief executive Philip Jansen.
Philip is a proven leader with outstanding
experience in managing large, complex
businesses and has the right combination
of skills and experience to take BT into the
future. Philip has made an excellent start as
chief executive and I am confi dent that he
will have the full support of all our people as
we embark on the challenging but exciting
next chapter of this great company.
This is a very important time for BT and
the UK’s digital economy. I look forward to
working with Philip and his team as they
develop our strategy and accelerate the
reshaping of BT to deliver future success.
Jan du Plessis
Chairman
8 May 2019
Full year d ividend per share
15.4 p
Revenue
£23 .4 bn (1) %
Profi t after tax
£ 2. 2bn + 6 %
We have made good progress on
delivering our strategy, focused
around diff erentiated customer
experience, our best converged
network, and creating a simple,
lean and agile business.
A message from
our Chairman

3
BT Group plc Annual Report 2019 Strategic report
Governance
Financial statements
Additional information
My fi rst priority on joining in January was
to meet as many BT colleagues as possible,
and I have seen fi rst-hand the energy and
commitment they bring to doing the right
thing by our customers. As we build the BT
of the future, this dedication will be essential
for transforming the company and improving
the service we provide to our customers.
Many of our people talk to customers every
day and can provide great insight into
how they think. The way our customers
see the world and our role in their lives
and businesses is changing. In the coming
year we will focus on developing a better
understanding of what customers value
about BT in each of our market segments.
BT is already making signifi cant investments
in our key markets and we have a very
strong market position, but we need to
invest more in our core areas to drive
future growth. Constant innovation is key
to keeping our business moving forward.
Our increasing investment in fi bre and 5G
programmes is vital to our future success.
Our relationship with the UK Government
and Ofcom continues to improve. We’re
working in a pragmatic, straightforward
and collaborative way. We want to shape
the regulatory environment so that it
is clear and predictable, enabling BT to
succeed by delivering sustainable value that
r e fl e cts what customers and society want.
Our core priorities around customer
experience, building the best converged
network and transforming our operating
model underpin how we will compete and
drive sustainable growth.
Everything we do should start with the
aim of delivering a diff erentiated customer
experience. We are already making
progress with this . W e introduced our fi rst
converged products, BT Plus, for consumers
and 4G Assure, for small businesses, which
ha ve seen strong take-up . In the coming
year there will be additional investment to
improve our propositions, off er great value
for money and increase consumer loyalty.
We will also invest to maintain our network
leadership position. We already have the
best mobile and fi xed networks and in the
coming year we will launch 5G across 16
UK cities and accelerate our rollout of FTTP.
Although important points still need to be
agreed, our dialogue with the Government
and Ofcom is constructive and we are
increasingly confi dent in the environment
for investment in the UK. As a result w e
are increasing our aim of reaching 3 million
homes to 4 million by March 2021 and
15million by the mid-2020’s, subject to
conditions being right .
BT has made progress during the year
towards creating a simplifi ed, lean and
more agile business. We will make further
improvements in the coming year to
speed up decision making and the pace
of work, making use of the latest digital
technologies. Our people recognise we are
too complex and want us to go faster in our
transformation. Employee engagement is
high, with a 77% engagement outcome
for colleagues participating in our
recent people survey. The results were
generally encouraging, and demonstrate
our collective desire to embrace the
changes required to make BT a brilliant
place to work and give our customers an
outstanding experience.
I am pleased to see how much our people
contribute to the community and am proud
that BT encourages this work. One area I
want us to really lead on is improving digital
skills – for our colleagues, customers and
families across the UK and well beyond. BT is
uniquely qualifi ed to help people navigate the
opportunities and challenges of our digital
age. Enabling these skills will help people
adapt to new ways of working and create
future customer demand for our products.
We’re committed to respecting human and
digital rights – we launched an overarching
human rights policy, and we’re partnering
with others to combat modern slavery.
We continue to tackle environmental
challenges, having recently announced our
ambition to be a net zero carbon emissions
business by 2045.
BT has delivered solid results for the year ,
and this is due to the commitment of our
colleagues. The markets we are in remain
highly competitive and w e continue to
expect market dynamics, cost infl ation and
legacy product declines and the changing
regulatory environment to impact our
results in the short term, however, we are
confi dent that our plans will deliver good
returns over the medium term and improve
the quality and performance of the business.
As a result, for 2019/20, we expect
adjusted revenue to be down around 2%.
This is mainly as a result of the challenging
market conditions, regulatory pressure
in both fi xed and mobile markets, and
the ongoing impact from our decision to
de-emphasise lower margin products,
particularly in our enterprise businesses.
Along with the fl ow through of lower
revenue, we expect our opex investments
to result in Group adjusted EBITDA for
2019/20 being in the range £7.2bn –
£7.3bn. While we will sustain these opex
investments into 2020/21, we continue
to expect Group adjusted EBITDA for
2020/21 to be above that for 2019/20.
We are raising our reported capital
expenditure guidance (excluding BDUK
clawback) for 2019/20 to be in a range of
£3.7bn – £3.9bn. We expect normalised
free cash fl ow for 2019/20 to out-turn in
the range £1.9bn – £2.1bn.
I look forward to working alongside our
colleagues to build the new BT and I am
optimistic and energised for the future.
Philip Jansen
Chief Executive
8 May 2019
I am delighted to be the new
chief executive of BT. We play
a n important role in UK society
and provide mission-critical
services all around the world. It is
a privilege to lead such a special
company, with a great history and
a very exciting future. BT creates
value for a large and diverse
group of stakeholders.
A message from
our Chief Executive

4
BT Group plc Annual Report 2019
About BT
Revenue
£23.4bn (1)%
Prot before tax
£2.7bn +2%
Basic earnings per share
21.8p +6%
Net cash inow from
operating activities
£4.3bn (14)%
Change in underlying
a
revenue
(0.9)%
Adjusted
b
EBITDA
£7.4bn (2)%
Adjusted
b
earnings per share
26.3p (6)%
Normalised free
cash ow
c
£2.4bn (18)%
Capital expenditure
d
(excluding BDUK clawback)
£3.8bn +8%
Who we are
We’re one of the world’s leading
communications services companies.
We’re based in the UK but we serve
customers in 180 countries.
What we do
We develop and sell communications
products and services and build
and operate networks that are
an essential part of modern lives,
businesses and communities.
How we’re organised
BT is organised into two types of
units: customer-facing units that sell
products and services and corporate
units that support the whole group.
Financial highlights
For more information on our
nancial performance see page 34.
4
BT Group plc Annual Report 2019
Alternative performance measures
We assess the performance of the group using a variety of performance measures. These measures are not all dened
under IFRS and are therefore termed ‘non-GAAP’ measures. We present a reconciliation from these non-GAAP
measures to the nearest prepared measure in accordance with IFRS on pages 185 to 187. The alternative performance
measures we use may not be directly comparable with similarly titled measures used by other companies
.
a
Underlying revenue excludes specic items, foreign exchange movements and disposals.
b
Items presented as adjusted are stated before specic items. See page 185 for more information.
c
After net interest paid, before pension decit payments (including the cash tax benet of pension
decit payments) and specic items.
d
Additions to property, plant and equipment and software in the period less proceeds from disposals.

5
BT Group plc Annual Report 2019 Strategic report
Governance
Financial statements
Additional information
Openreach
We build and operate the xed network
that connects the UK’s homes and
businesses. We are responsible for
providing wholesale ‘last mile’ xed access
from premises to exchanges, and installing
and maintaining the bre and copper
communications networks.
Led by
Clive Selley
CEO, Openreach
Consumer
Across our three brands – BT, EE and
Plusnet – we connect customers to
information, entertainment, friends
and family, at home and on the move.
Between them, the three brands serve
the whole of the UK, providing mobile,
broadband, home phone and TV services.
We buy access to xed-line and broadband
infrastructure from Openreach, and we
use EE’s mobile network to provide mobile
phone services.
Led by
Marc Allera
CEO, Consumer
Enterprise
We sell communications and IT services to
businesses and public sector organisations
in the UK and Ireland. We also provide
network products and services to
communications providers operating in
Great Britain. We’re focused on four main
product markets: xed voice, mobile,
converged connectivity and networked
IT services.
Led by
Gerry McQuade
CEO, Enterprise
Global Services
We are a leading enterprise
communications provider, serving
enterprise customers in 180 countries.
We provide managed network and
IT infrastructure services, enabling
customers’ digital transformations.
Led by
Bas Burger
CEO, Global Services
Strategy and Transformation
We are responsible for developing and
setting corporate, network and product
strategies for the group. We also drive
pan-BT transformation programmes.
Led by
Michael Sherman
Chief strategy
and transformation ocer
Technology
We are responsible for designing,
building and operating BT’s core and
mobile networks, platforms and IT
systems in the UK and globally. We also
work with the customer-facing units
to develop and roll out products and
services for their customers.
Led by
Howard Watson
Chief technology
and information ocer
Corporate functions
The remaining corporate units carry out
central activities on behalf of the group.
We benet from shared expertise and
economies of scale. They include: Finance,
HR, Legal and Company Secretarial,
Compliance, Corporate Aairs, Property,
Facilities, Procurement, Regulatory Aairs
and Group Business Services.
Our customer-facing units Our corporate units
External revenue
£10,588m +3%
Percentage of
group revenue
45%
External revenue
£4,735m (6)%
Percentage of
group revenue
20%
External revenue
£2,200m (3)%
Percentage of
group revenue
10%
External revenue
£5,933m (4)%
Percentage of
group revenue
25%
5
BT Group plc Annual Report 2019 Strategic report
Governance
Financial statements
Additional information

76
BT Group plc BT Group plcAnnual Report 2019 Annual Report 2019 Strategic report
Governance
Financial statements
Additional information
The
Executive Committee
provides input and
recommendations
to support the chief
executive in exercising
the authority delegated
by the Board to run the
business of the group
day -to -day. It meets
weekly and is chaired by
the chief executive.
The
Executive Committee
assists the chief executive in:
• developing the group
strategy and budget for
the Board’s approval
• executing the strategic plan
once agreed by the Board
• providing assurance to the
Board in relation to overall
performance and risk
management.
All decisions are taken by
the chief executive, or his
delegate, in keeping with
the principle of single point
accountability.
Clive Selley
Invitee, CEO, Openreach
Clive was appointed CEO, Openreach in
February 2016. He was formerly CEO, BT
Technology, Service & Operations, CEO
BT innovate & design and before that
president, BT Global Services portfolio
& service design. The CEO of Openreach
cannot be a member of the
Executive
Committee
under the provisions of the
Commitments. Clive attends
Executive
Committee
meetings as appropriate.
Philip Jansen
Chief executive
Appointed as chief executive in February 2019
and on the Board since January 2019.
Philip joined BT from Worldpay where he had
been CEO since April 2013. Before that he
was CEO and then chairman at Brakes Group
between 2010 and 2015. Philip spent the
previous six years at Sodexo where he was group
chief operating offi cer and chief executive,
Europe, South Africa and India. Prior to that he
was chief operating offi cer at MyTravel Group
from 2002 to 2004 and managing director of
Telewest Communications (now Virgin Media)
from 200 0 to 2002, after starting his career at
Procter & Gamble.
Simon Lowth
Chief fi nancial offi cer
Appointed to the Board as chief fi nancial offi cer
in July 2016.
Simon was CFO and executive director of
BG Group before the takeover by Royal Dutch
Shell in February 2016. Previously Simon was
CFO and an executive director of AstraZeneca,
and fi nance director and executive director of
ScottishPower. Prior to that, Simon was a director
of McKinsey & Company.
Gerry McQuade
CEO, Enterprise
Appointed CEO, Wholesale and Ventures in March
2016 and became CEO, Enterprise in May 2018.
Gerry was formerly chief sales and marketing
offi cer at EE responsible for the business,
wholesale and product development areas which
he had overseen since the merger in 2010 of
Orange and T-Mobile. He joined the board of
Orange in January 2008, and prior to Orange
he was a founding director of Virgin Mobile.
Ed Petter
Corporate aff airs director
Appointed November 2016.
Ed was formerly deputy director of corporate
aff airs at Lloyds Banking Group . Prior to that he
held corporate aff airs roles at McDonald’s Europe,
McKinsey & Company and the Blue Rubicon
communications consultancy, having previously
worked as a news producer and editor at the BBC.
Cathryn Ross
Regulatory aff airs director
Appointed January 2018.
Cathryn was formerly chief executive of Ofwat,
the independent economic regulator for the
water and waste water sector in England and
Wales. Cathryn is an experienced regulatory
and competition economist and has worked
across a number of diff erent sectors advising on
economic, regulatory and competition issues.
Howard Watson
Chief technology and information offi cer
Appointed February 2016.
Howard was formerly chief architect and
managing director, global IT systems and led the
technical teams behind the launch of BT Sport
in 2013.
Howard joined BT in 2011 and has 30 years
of telecoms experience having spent time at
Telewest Communications (now Virgin Media)
and Cartesian, a telecommunications consultancy
and software company.
Michael Sherman
Chief strategy and transformation offi cer
Appointed May 2018.
Michael is responsible for developing BT’s long-
term strategy and guiding pan-BT business
transformation. Prior to BT, Michael was a
partner and managing director at Boston
Consulting Group for 11 years. Before that,
Michael spent eight years as an executive at
Viewlocity, an enterprise software company.
Alison Wilcox
HR director
Appointed July 2015.
Alison was formerly regional HR director for
Vodafone Europe and before that, r egional HR
d irector for Vodafone’s Africa, Middle East and
Asia Pacifi c footprint. Alison joined Vodafone in
2006 as group director of leadership following
a career in consulting.
Marc Allera
CEO, Consumer
Appointed February 2016 as CEO, EE and
became CEO, Consumer in September 2017.
Marc was previously chief commercial offi cer for
EE from 2011 to 2015. Marc spent ten years
at Three UK as sales and marketing director and
subsequently chief commercial offi cer. Prior to
that, Marc was general manager of Sega UK
and Europe.
Sabine Chalmers
General counsel
Appointed April 2018.
Before joining BT, Sabine was chief legal and
corporate aff airs offi cer and company secretary
of Anheuser-Busch InBev for 12 years. She also
held various legal leadership roles at Diageo.
Sabine is qualifi ed to practise law in England
and Wales and New York State.
Bas Burger
CEO, Global Services
Appointed June 2017.
Bas was formerly president, BT in the Americas,
BT Global Services. Bas joined BT in 2008 as
CEO Benelux.
Before joining BT, Bas was executive president
and a member of the management committee of
Getronics NV, where he ran global sales, channels
and partnerships, developing the company’s
international business. He was also CEO and
managing director of KPN Entercom Solutions.
Executive Committee
Rachel Canham
Company secretary & general
counsel, governance
Rachel is company secretary of BT
Group plc. She joined BT in 2011 as a senior
commercial lawyer before becoming chief
counsel for mergers & acquisitions in 2013.
Rachel was appointed company secretary &
general counsel, governance in November
2018. Rachel attends all
Executive
Committee
meetings.
8
BT Group plc Annual Report 2019
8
BT Group plc Annual Report 2019
Service providers Our markets
Our brands
UK xed
connectivity
UK Mobile TV and content
Converged
connectivity
and services
Global
telecoms services
Fixed
infrastructure
BT
EE
Plusnet
Openreach
Selected competitors
primary oering
Amazon Prime Video
Apple TV
CityFibre
Giga
Hyperoptic
Netix
O2
Orange Business Solutions
Sky
TalkTalk
Three
Virgin Media
Vodafone
Please note that these are primary oerings. We acknowledge that our competitors also have secondary oerings in some of our markets in addition to the above.
Market context
By understanding market trends in our own industry and in others
that aect us, we can take advantage of opportunities as they arise
and act more quickly to reduce any risks to our business.
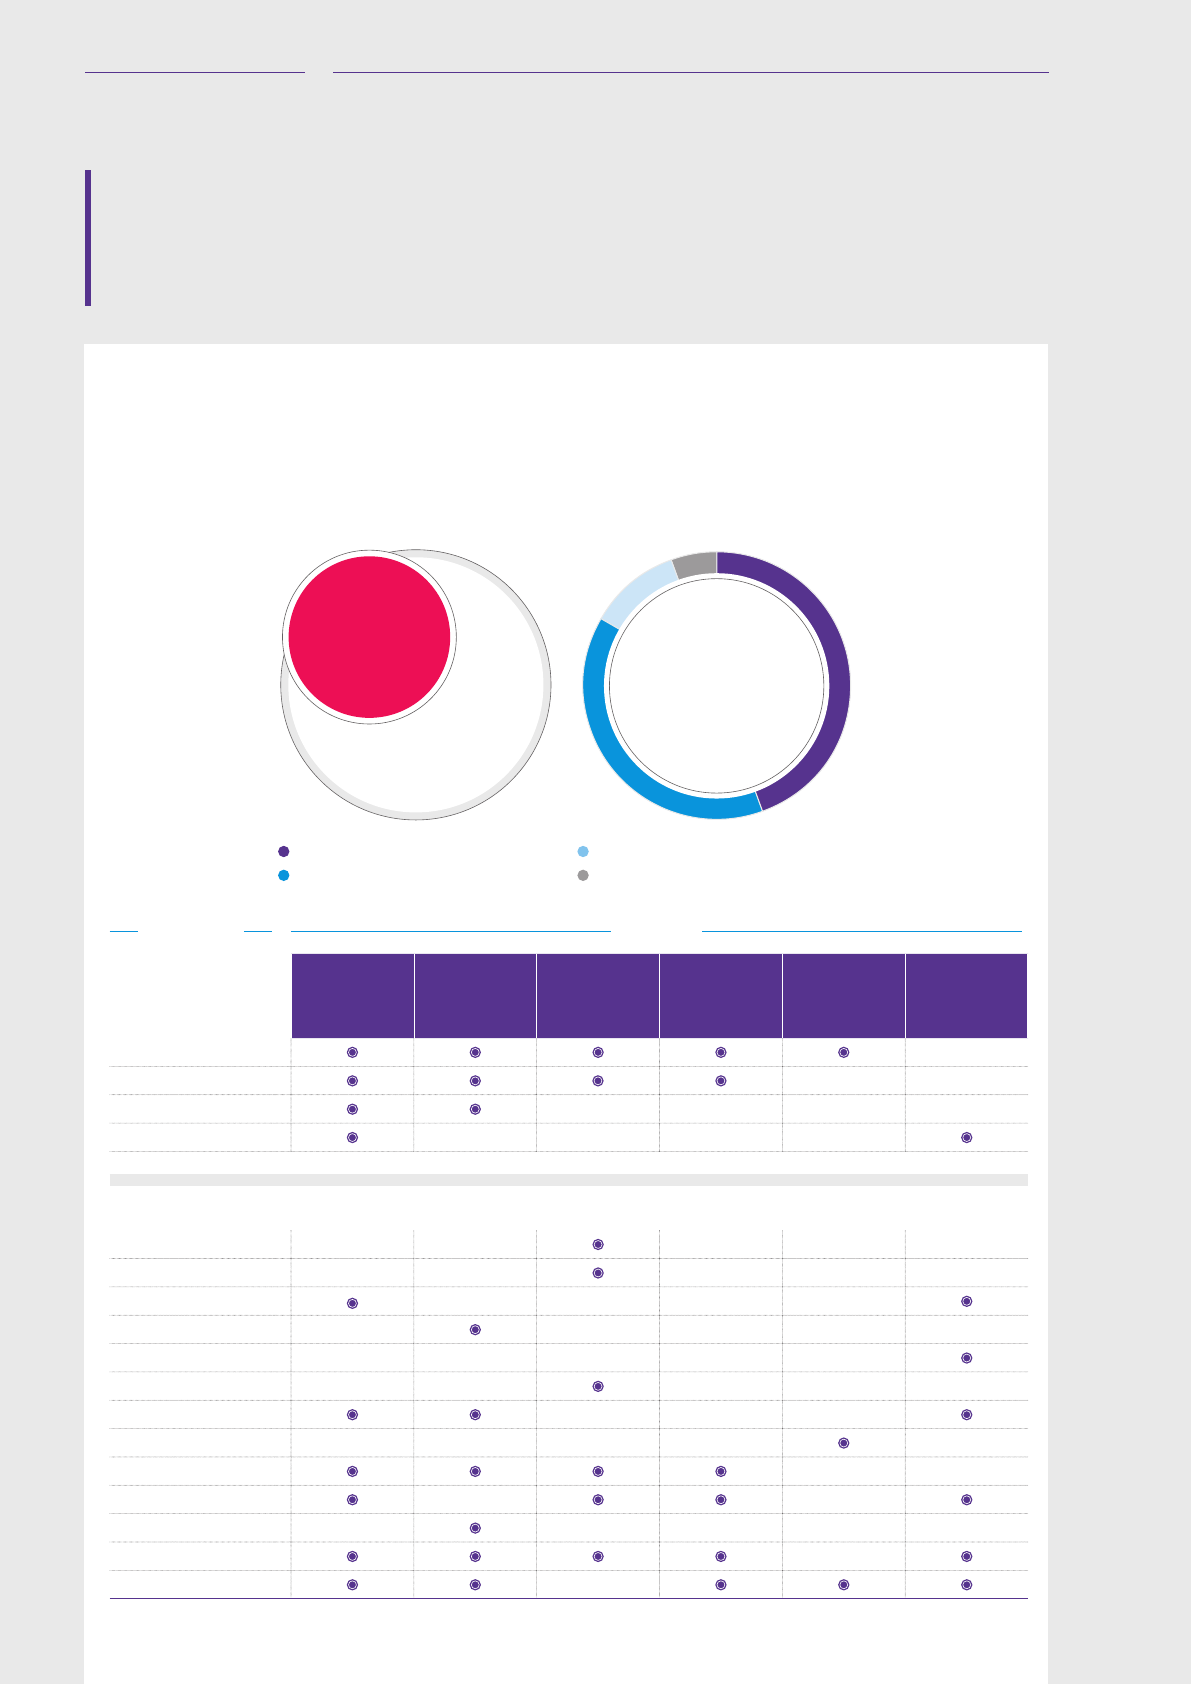
Our share of UK households
(Number of households)
Homes with EE relationship 8m
Homes with BT relationship 7m
Homes with a relationship with both BT & EE 2m
Homes with a relationship with Plusnet 1m
27m
Number of
homes in the UK
15m
BT UK share
15m
BT UK share

9
BT Group plc Annual Report 2019 Strategic report
Governance
Financial statements
Additional information
UK mobile
Providing mobile
connectivity to
consumers, businesses
and MVNOs.
This market includes any data or voice services
on mobile devices. It is a major segment of our
business.
We use EE’s mobile network to provide mobile
phone services across our three brands to the
whole of the UK.
Both Consumer and Enterprise sell mobile
services in this market.
Another aspect of the mobile market is
wholesaling to Mobile Virtual Network
Operators (MVNOs) in the UK, where Mobile
Network Operators oer wholesale mobile
connectivity.
Historically, the mobile market has largely
been driven by handset launches. Less
innovation and dierentiation mean
consumers are keeping their handset for
longer and visiting stores less often. This trend
is leading to increased uptake of SIM-only
plans in the market. We also see market
volume growth coming from consumers
buying extra SIMs and devices and using
more data.
Businesses are increasingly letting their
people use their own smartphones at work.
Despite that, they are continuing to buy
large data bundles to support their people’s
increasing mobile data use, for example in
areas such as collaboration.
The UK currently has more than 100 MVNOs
and we are one of the leading providers of
MVNO services.
UK xed connectivity
Providing xed
broadband services to
consumers, businesses
and communications
providers.
We connect customers to information,
entertainment, and friends and family,
at home.
Fixed connectivity includes providing
connectivity directly to homes or businesses
and is our biggest market by revenue. It
includes voice telephony, internet access and
the provision of dedicated lines for business
and public sector customers.
Within Enterprise, we have three main types
of customers with dierent communications
needs:
• Small and Medium Enterprise customers,
who we dene as having fewer than
100 employees, often rely heavily on
communications services and look for more
consumer-style products.
• Corporate customers, who often have more
complex needs, and who are increasingly
buying more security and cloud-based
products.
• Public Sector and Major Business customers,
who look to buy both xed and mobile
services in multi-year contracts and who
can demand very high security.
We also serve communications providers who
want to buy solutions to sell on to their end
customers.
This segment is experiencing a technology
migration from the legacy Public Switched
Telephone Network (PSTN) to Internet
Protocol (IP). The UK Government actively
supports this.
In Consumer, xed internet connectivity is
increasingly essential to our individual and
household customers, with each using an
average of 240GB a year. In 2018, nine in
ten people had access to the internet in their
home. Many adults claim to spend as much as
24 hours per week online, more than twice as
much as in 2007.
Price competition on phone calls and
broadband continues to be intense. Therefore,
revenue opportunities in this segment focus
on increased demand for higher speed and
better-quality products, driven by consumers
and businesses using more data.

10
BT Group plc Annual Report 2019
Market context continued
TV and content
Providing TV content
to customers.
We sell TV content in our Consumer division
under our BT and EE brands.
We also wholesale BT Sport to other providers.
The UK has a well-established free-to-air TV
service, on top of which consumers buy many
premium content packages including live
sport, which continues to be a staple in most
UK homes.
In comparison to ‘cord-cutting’ where
consumers abandon TV packages in favour
of a range of over-the-top (OTT) streaming
media oers, we are seeing some evidence of
‘package-thinning’ as an emerging feature
of the market. This is where customers buy
the most basic package to get TV access and
accentuate this with on-demand OTT content.
These trends are aecting traditional
providers in limiting their ability to sell
premium monthly content subscription
packages.
Converged connectivity and services
Providing converged
products and services
to customers.
With our xed and mobile networks, we are
well positioned in the converged connectivity
and services market.
We have launched BT Plus, the UK’s rst
converged bre and 4G plan that gives
customers BT’s fastest speeds in and out of the
home with a unique Keep Connected Promise,
all on one simple bill.
We launched 4G Assure for our business
customers, providing 4G connectivity if their
xed broadband service was not available.
The UK is in the early stages of convergence –
the bundling of xed, mobile and TV services
into a single service.
Convergence can increase customer lifetime
value, as those taking converged oers tend
to be more loyal.
Greater connectivity and new devices will
lead to new possibilities for technology
convergence. As an example, people can
already answer their front doors and adjust
their central heating remotely using Internet
of Things (IoT) technology.
Applications like smart homes and connected
cities are no longer ideas beyond the horizon
– they are here and are already part of many
major economies.

11
BT Group plc Annual Report 2019 Strategic report
Governance
Financial statements
Additional information
Global ICT services
Providing ICT services to
global enterprises.
The global ICT services market includes
security, network and IT services and is highly
competitive, with many players. It includes
local markets – often dominated by incumbent
communications providers – and the global
enterprise-grade xed line services market.
Global Services operates in this market,
leveraging the strengths of the BT network
and capabilities, to deliver the tailored service
that customers need.
The demands of business customers are
changing. For example, they are moving
from traditional voice services to digital
voice services – from MPLS (Multi Protocol
Label Switching) to services such as SD-WAN
(Software-Dened Wide Area Networks).
They are also increasingly focused on solving
security challenges.
Companies value partners with the knowledge
to help them on this journey. They rely on
their technical expertise and scale to help
them benet from advanced services, in
multiple regions, across infrastructures with
mixed technologies and standards.
Fixed infrastructure
Providing network
access to
communications
providers.
In just under half of the xed infrastructure
market, Openreach is the main provider to
communications providers, who then oer
services to their home and business customers.
In the rest, we overlap with our biggest cable
and bre competitors.
Openreach is deploying new technologies such
as Fibre to the Premises (FTTP) and Gfast to
improve the performance and quality of its
network. It also provides regulated access to
its passive network assets (ducts and poles) to
support network build by other providers.
The UK has a large xed access network
consisting of bre and copper communication
networks. Openreach operates in the UK’s
regulated, xed access market and trades
mainly with communications providers. It is
responsible for providing services over the
local access network, sometimes referred to as
the ‘last mile’, installing and maintaining the
bre and copper communications networks
that connect homes and businesses.
1312
BT Group plc BT Group plcAnnual Report 2019 Annual Report 2019 Strategic report
Governance
Financial statements
Additional information
Our business model is centred
around providing customers with
communications and connectivity
services, while delivering great
experiences and maintaining
long- term relationships.
Our customers and what we off er them
Our customers are consumers, businesses,
multinational corporations, public sector
organisations and other communications
providers.
We sell fi xed-voice, broadband, mobile and TV
to UK consumers, with a range of ancillary products
and services such as handsets and insurance. For
our UK and global business customers, our services
range from phone and broadband to complex
managed networks, IT services and cyber security.
We also sell wholesale access products and services
to UK communications providers.
Customers primarily buy through monthly,
recurring subscriptions or contracts, which provide
us with ongoing and predictable revenue. This is
comple mented by pay-as-you-go mobile services.
Individuals, households and SMEs pay for
standalone or bundled services, typically on 12- to
24-month contracts. In addition, large enterprise
customers – both domestic and international – buy
managed services on multi-year contracts.
Wholesale contracts range from one month for
regulated products, to fi ve years or more for
major managed services deals.
To create lasting revenue and profi t, we focus on
providing a diff erentiated customer experience,
measured through Net Promoter Score (NPS
a
),
which has improved over 11 consecutive quarters.
a
Group NPS measures Net Promoter Score in our retail business
and Net Satisfaction in our wholesale business.
Information linked to our business model
About BT – we explain how we’re organised
and how and where we operate on page 4 .
Strategy – our strategy supports our business
model and is on page 14 .
Principal risks and uncertainties – we describe
these and how we manage them on page 46 .
Viability statement – our directors’ assessment
of our prospects and viability is on page 54 .
Governance – we describe how we govern
our business from page 55 .
Remuneration – the directors’ remuneration
report is from page 73 .
Our organisation
Cu sto mers
Corporate units
Strategy and
Transformation
Technology
Consumer Enterprise
Global Services Openreach
Corporate
Functions
We build
We build fi xed and mobile
connectivity across the UK,
creating the UK’s leading
network.
We innovate
We use our customer insight
and technical skills to create
new connectivity- based
products and solutions.
We se ll
Through our brands, we sell
products and services to build
trust, create value and
generate loyalty.
We operate
We operate fast, secure and
reliable fi xed and mobile
networks that deliver what
our customers need.
What we do
Our purpose
To use the power of communications to make a better world .
Our goal
Drive sustainable growth in value. Lead in converged connectivity
and services, seize new business opportunities and deliver industry -
leading effi ciency.
Stakeholder outcomes
Our business
model
1312
BT Group plc BT Group plcAnnual Report 2019 Annual Report 2019 Strategic report
Governance
Financial statements
Additional information
International Integrated
Reporting Council’s capitals
This key provides a mapping to the ‘capitals’ of
the IIRC’s Integrated Reporting (IR) Framework.
You can fi nd out more at the iirc.org
F
Financial
H
Human
M
Manufactured
I
Intellectual
S
Social
N
Natural
What sets us apart
We have a unique combination of people, technology, content, networks
and other physical assets that sets us apart and supports us in adding value:
F
Financial strength
Our cash fl ows provide us with the funding
to make long-term investments. This year we
invested £ 2 .1bn in our network and generated
£ 2.4bn normalised free cash fl ow, to support
investment in future years.
H
Our people
The commitment, expertise and diversity of
our people are key to our success. We have
106,700 employees, 84,300 of whom are
in the UK.
S
Our customer base
The size, scope and breadth of our customer
base gives us an advantage over our
competitors. We have a total of around
26.8million consumer customers, 1.1
million UK business customers and 4,100
multinational customers.
M
Networks and physical assets
We maintain a substantial core network
with key fi xed and mobile assets, such as our
superfast fi bre broadband footprint of 27.5
million homes and businesses and our mobile
spectrum assets.
I
Our brands
We own three retail brands: BT, EE and Plusnet.
We also own the Openreach brand which serves
communications providers.
M
Retail footprint
In the UK we have more than 600 retail stores,
giving us the largest retail footprint of any
mobile network operator.
I
Innovation
This year we spent £643 m on research and
development enabling us to stay at the
forefront of a rapidly changing world. We have
a portfolio of more than 5,000 patents and
applications, with 10 3 patent applications for
inventions fi led in 2018/19. As an example we
are currently market leaders in the rollout of 4 G
and intend to lead the market to 5 G.
N
Partners
Our business model relies on partners
and suppliers.
£2.4bn
Normalised free
cash fl ow
106,700
Total number
of employees
28 m
Total number of
customers worldwide
27.9m
Homes and businesses
with superfast fi bre
broadband
600
Retail stores
throughout the UK
1 00
Number of countries
we have suppliers in
Our brands
£ 643 m
R& D spend
5. 4 %
Improvements in Right
First Time performance
3. 4m
BT Call Protect
customers
Customers
2m
Children reached
through the Barefoot
Computing programme
87%
Electricity used from
renewable sources
worldwide (UK now
at 100% directly
purchased)
Communities and society
77 %
Employee engagement
outcome
1,400
Agency workers
converted to
permanent
Colleagues
£13.4 bn
Spent with
suppliers
67%
With top 1 00
suppliers
Suppliers
10.78 p
Proposed fi nal dividend
per share
1 5.40 p
F ull year dividend
per share
Shareholders
1,800
UK public sector
customers
Government

14
BT Group plc Annual Report 2019
14
BT Group plc Annual Report 2019
Our strategy is to lead in
converged connectivity and
services, capitalising on new
business opportunities and
delivering industry-leading
operational eciency. This is
to support our goal of
delivering sustainable
growth in value.
Our markets are transitioning but they are
still based on the universal need to connect
and communicate, a need which has never
been more essential.
Creating experiences for our customers that
truly dierentiate us from our competitors is
at the centre of our strategic framework.
Everything we do with respect to building
the best converged network, and becoming
a simpler, leaner and more agile business,
needs to ultimately support our strategy to
deliver great customer experience.
We have underpinned our strategy to full
the needs of two other critical stakeholder
groups – our people and the communities in
which we do business. For our people, our
strategy is to make BT a brilliant place to
work. For the communities we operate in,
our strategy is to be a valued partner in
helping to build better digital lives.
Our strategy
Our purpose
Our goal
Customer
Colleague
Community
Our strategy
Our values
To use the power of communications to make a better world
A brilliant place to work
A valued partner helping build better digital lives
Drive sustainable growth in value
Lead in converged connectivity and services, seize new business opportunities
and deliver industry leading eciency
Personal Simple Brilliant
Best
converged
network
Dierentiated
customer
experience
Simplied,
lean and agile
business

15
BT Group plc Annual Report 2019 Strategic report
Governance
Financial statements
Additional information
For more information
see page 18.
For more information
see page 16.
For more information
see page 20.
Customers want fast, secure,
seamless and reliable connectivity
to enable their digital lives and
businesses. Therefore we must
deliver the best converged
network in the UK through our
rollout of FTTP and 5G.
Consumers and businesses have
more choice than ever about
how they communicate and
the company they choose to
buy from. We want to deliver a
brilliant experience to encourage
existing customers to stay with
us and do more with us, and to
encourage potential customers to
switch to us. We aim to oer easy,
personalised experiences across
our channels and deliver seamless
digital services.
Markets today are more
dynamic and competitive and
we operate in a complicated and
regulated space. We are creating
a simplied and lean business
with agile ways of working. This
means continually modernising
our organisation, changing how
we work to do things better for
less cost, and simplifying our
products, processes and systems.
Strengths and opportunities
Our long-standing relationships with home
and business customers give us a platform
for continued investment.
Our investments result in long-lasting
assets. This includes nationwide networks,
where we are investing in the critical physical
components – such as cabling, switches and
routers – of the digital economy of the near
future. Our strategy supports the building of
a robust network that will underpin the
growth of the digital economy, and
enhanced connectivity in all parts of the UK.
Our network also creates a robust physical
foundation for many uses in next generation
technologies which need the best
connectivity. We will own the foundation
and therefore be in an unrivalled position.
We see signicant opportunities in the
advancement of Articial Intelligence
(AI) and machine learning, for new
communications methods, such as virtual
and augmented reality, and for connected
devices. All of these opportunities require
great connectivity, which we will need to
support.
As a major player in the UK communications
market we have a responsibility to do the
right thing for the UK and make sure we
operate within a fair regulatory framework
and clear ethical boundaries. But being a
player with substantial resources and a large
and diverse customer base also gives us a
real strategic advantage.
In global markets we are often a challenger
to the incumbent, presenting an opportunity
to innovate and move faster to deliver secure
hybrid network solutions that support our
customers’ migration to new digital
technologies.
For more on the risks that aect us
see page 46.
BT Group plc Annual Report 2019
15
Strategic report
Governance
Financial statements
Additional information
Dierentiated
customer
experience
Best
converged
network
Simplied,
lean and agile
business

16
BT Group plc Annual Report 2019
3.
Strategic progress
Delivering a dierentiated customer experience
Creating an outstanding customer experience for all our
customers, backed by the best network, is central to
our long-term growth and future success. We are
making progress but we want to go further.
Everyone at BT is responsible for
providing a brilliant customer experience.
We want our customers to enjoy using
the products, services and support
channels that we provide.
We measure customer experience in two
dierent, but complementary, ways:
customer experience (based on Net
Promoter Score) and how often we get
things Right First Time (RFT).
We regularly review the priorities of both
our consumer and business customers,
and will be evolving our RFT metric for
2019/20 to reect this.
Our evolved measure, Keeping Our
Promises, is focused on us meeting the
commitments we make and providing
a more reliable service.
NPS has increased over 11 consecutive
quarters, with this year’s overall score 6.5
points better than last year’s. RFT was
up 5.4%.
These improvements are largely due to
our consistent approach over the past
three years, focusing on:
42
We have met or exceeded all of Ofcom’s
42 Minimum Service Level targets on
copper and broadband services
<1.8%
We now miss less than 1.8% of
engineeringappointments
1. Delivering a consistent
and reliable service
600 shops
Customers can now talk to us face-
to-face in more than 600 EE shops
45Mbps
Average broadband speeds for BT
consumer customers is 45Mbps
2. Loyalty and value
90%
More than 90% of Samsung mobile
phones were repaired on the same day
SD-WAN
Launched innovative converged
business products such as SD-WAN
3. Products that t our
customers’ needs
180
Next generation SD-WAN is
available in 180 countries
First
First foreign communications provider
to be awarded a licence in China
4. Enabling digital
global business

17
BT Group plc Annual Report 2019 Strategic report
Governance
Financial statements
Additional information
1. Delivering a consistent
and reliable service
The communications we enable are so
essential to our customers that delayed
orders, faults or service disruptions can cause
signicant distress. This year, therefore, our
investments included:
• speeding up our ultrafast bre rollout
(FTTP), passing an average of c14,000
new premises every week in 2018/19.
• hiring over 4,000 new contact centre
agents, and switching 800 from agency
contracts to full time, helping cut call
centre wait times for business customers
by a third and for EE broadband customers
by a half.
• increasing the proportion of all BT brand
Consumer service conversations handled
in the UK to around 83%, and working
towards a target of 100%. All BT Plus, EE
and Plusnet calls are handled in the UK
• improving our eChat service, which is now
used by one in ve BT brand Consumer
customers for service queries.
• increasing our intake of engineering
apprentices by around 1,700.
We are innovating to improve the experience
of our customers. For example, we are using
remote visual assistant technology to help
our call centre agents and our engineers
provide expert advice more quickly.
Openreach’s proactive maintenance meant
we had 2% fewer copper network faults than
in 2017/18, Global Services transformation
has enabled 71% of service incidents to be
proactively detected. Openreach provided
99% of all customers with their rst
appointment date for a new service within
12 days, an improvement from 92% in
2017/18. Customer complaints to Ofcom
reduced by a third for both BT’s consumer
broadband and EE’s mobile customers when
measured on a year-on-year basis.
Like many businesses, our complexity is still
a challenge. But making our portfolio smaller
and simplifying our processes will cut the
cost and inertia that leads to poor customer
experience.
Service progress around BT
• We have met or exceeded all of Ofcom’s 42
Minimum Service Level targets on copper
and broadband services.
• We now miss less than 1.8% of
engineering appointments, 23% fewer
than last year.
• Average Ethernet provisioning times went
down 7.6% compared to last year.
• Enterprise won two golds at the UK
Customer Experience Awards.
2. Loyalty and value
We want to reward customer loyalty by
focusing on value for money.
There will be no price increases for our BT
brand consumer broadband, line rental and
mobile products in 2019.
We want to do more than just stop customers
leaving. We want to build more loyalty across
all our brands, by focusing on value for money.
We want customers to increasingly get more
for their money – whether that is faster
broadband speeds or better mobile coverage.
Loyalty and value progress around BT
• Customers can talk to us face-to-face
in more than 600 EE shops about BT
broadband and TV and EE products and
services, with a full BT service planned for
the end of 2019/20.
• Average broadband speeds for BT’s
Consumer customers have improved 10%
to 45Mbps.
• We now have nearly 3.4 million customers
using our Call Protect product, preventing
more than 220 million unwanted calls
since launch in January 2017.
3. Products that t our
customers’ needs
Our BT Plus convergence proposition includes
mobile replacement, guaranteed minimum
speeds and double mobile data allowances
for customers.
BT Plus launched in May 2018 and has
around one million subscribers. Complete
Wi-Fi subsequently launched as an enhanced
version of the service and the take up has
been encouraging. BT Sport saw a 4%
audience increase for English Premier League
games and an 18% increase for Champions
League coverage.
We also launched BT’s new Stay Fast
Guarantee to improve customer experience
and reduce churn. We’ll optimise connection
performance for new and re-contracting
customers and then monitor and proactively
manage connection quality, oering £20
compensation if we cannot x speed issues.
We launched EE Smart Plans to expand our
dierentiation and drive value through more
for more oers. The handset plan came with
Swappable Benets to increase value and
encourage migration from SIM only, whilst
both handset and Smart SIM plans oer a
Service Pack including annual device health
checks, accessory vouchers and extended
device warranties.
Openreach launched a new volume-
related discount oer for communications
providers to help them boost their
customers’ adoption of higher-speed
and more reliable broadband services.
We have also started migrating customers
to our all-IP digital platform. This brings
opportunities for a range of richer
experiences and propositions – from smart
home technologies for consumers to
sophisticated voice services for SMEs.
Products progress around BT
• We have launched innovative converged
products for businesses such as BTNet,
SD-WAN and cloud solution collaboration
with Microsoft Azure.
• In TV, we are now a content super-
aggregator with Netix and Amazon Prime
already available, and Sky (via NOW TV) on
its way later in 2019.
• We launched a trial of fast mobile phone
delivery through Enjoy on EE (within the
M25) – oering customers delivery and
set-up of their smartphone as quickly as
two hours from placing their order.
• We launched a trial same-day repair
service with Samsung where more than
90% of repairs were xed on the same day
and 80% in the same hour.
• We launched 4G Assure for our business
customers, providing 4G connectivity if
their xed broadband service was not
available. Half of new SME business orders
now take this product.
4. Enabling digital
global business
Our Global Services unit is refocusing on
truly global customers. We are oering a
smaller portfolio of repeatable, scalable
cloud-of-clouds solutions – supported by
market-leading security – to give customers
exibility, choice and control. We are also
making processes smoother with self-service
tools and automation.
Digital global business progress around BT
• Next generation, SD-WAN services are
now available in 180 countries and we
have launched two new Cisco and Meraki-
based solutions.
• We were the rst to market with
Riverbed’s ‘Visibility as a Service’, which
allows customers to view and manage
their application trac.
• To help our customers migrate to the
cloud, last year we added Google and IBM
to the partners we already support on our
Cloud Connect Platform.
• Last year, a BT joint venture was awarded
domestic operating licences within China.
This is a major step towards allowing us to
better serve our multinational customers.

18
BT Group plc Annual Report 2019
Strategic progress
Building the best converged network
The converged network we are creating
is a long-term, sustainable asset. The investments
we make today are the foundation of tomorrow’s
digital services and our future revenue.
Our aim is to bring together our mobile,
broadband and wi- networks to
lead the market for converged digital
services, while reducing our network
costs by switching o assets like legacy
PSTN by 2025.
Our technology focus areas have stayed
the same over recent years, aligned
to meeting our customers’ needs to
connect and communicate. These are:
12.2m
We have 12.2m bre
broadband customers
3.2m
Number of homes and businesses
in the UK passed by our ultrafast bre
1. Superfast and ultrafast bre
16
We will launch 5G in 16 UK
cities in 2019
84%
The percentage of 4G geographic
coverage in the UK
2. Current and future mobile
First
EE is the rst UK network to support
all major smart home ecosystems
50%
By the end of March 2019 half
of SME broadband sales came
with4G Assure
3. Network integration

19
BT Group plc Annual Report 2019 Strategic report
Governance
Financial statements
Additional information
This year we made good progress, which
will continue next year. More of our
customers took up superfast broadband
products and we increased the pace of
our investments in ultrafast.
Ultimately, our ambition is to lead the UK
to 5G. We are starting to roll out our 5G
network, with 16 UK locations going live in
2019. We are proud of still being the best
network in the UK for current technologies,
such as 4G.
We believe bre is the future xed connection
to homes and we are rolling it out as fast
as possible. We are increasing our aim of
bringing FTTP from three million to four
million properties by the end of March 2021,
and our ambition to go from ten million
properties to 15 million by the mid-2020s,
subject to conditions being right.
To keep us in the lead for mobile, we are
switching 3G signal to 4G and upgrading
4G sites to enable more spectrum and give
customers a better experience. In 2018
we also acquired the spectrum we needed
to start rolling out 5G. There is another
spectrum auction happening in Spring 2020
where we expect to bid for more.
Commercial success increasingly depends on
innovation, which is why we invest in research
and development.
We are constantly looking at new innovations
to deploy – like edge computing to cut
network congestion and speed up
application performance.
This year we invested £643m (2017/18:
£632m) in innovation. Over the last decade
we’ve been one of the largest investors in
innovation in the UK, and globally in the
telecoms sector.
We have a portfolio of more than 5,000
patents and applications, with 103 patents
for inventions led in 2018/19.
1. Superfast and
ultrafast bre
a
We have now rolled out ultrafast bre to
3.2 million homes and businesses. As part
of the Openreach full bre rollout, we are
progressing build in 26 locations and in April
announced a further 12 locations to benet
from FTTP availability. This includes London,
Birmingham, Leeds, Manchester, Bristol,
Cardi, Edinburgh and Liverpool.
Superfast and ultrafast progress around BT
• We have 12.2 million superfast bre
broadband customers, within our footprint
of 27.5 million covering 86.6% of homes
and businesses.
• Our ultrafast bre footprint now reaches
more than 3.2 million homes and
businesses.
• EE will oer ultrafast broadband to
customers in summer 2019.
• We are working with government and
Ofcom on options for a broadband
Universal Service Obligation – to provide
100% of UK homes and businesses with a
minimum speed of 10Mbps by 2020.
2. Current and future
mobile
In August, RootMetrics named EE as the
UK’s best network for the fth year in a row.
Using Ofcom measures, our mobile network
now provides 84% geographic coverage in
the UK. We aim to be the UK’s rst mobile
provider to oer 5G, launching in 16 busy UK
cities in2019.
Mobile progress around BT
• We’ve switched on 5G sites in East London
and are rapidly launching more. We have
also trialled live 5G in Canary Wharf.
• We announced a partnership with OnePlus
on 5G in the UK. EE will be the rst mobile
operator in the world to oer the OnePlus
5G smartphone.
• We continue to increase capacity on 4G
sites, laying the foundation for our 5G
launch, and we have built more than
350 new 4G sites in the last 12 months
to connect previously unconnected rural
communities.
3. Network integration
We are bringing together our market-leading
mobile, broadband and wi- networks into
one converged, digital network to give
customers seamless connectivity wherever
they go. It will be the rst of its kind in the
UK. It is scheduled for completion in 2022
and when it launches it will signal a new era
of connectivity.
Network integration progress around BT
• EE showcased Hybrid Broadband,
combining mobile and xed connections
in one service.
• EE is the rst UK network to support all
major smart home ecosystems – with
partnerships including Google, Apple,
Alexa, Hive and Nest.
• We launched broadband with 4G
Assure for SME customers to keep their
broadband running if the xed connection
is lost. By the end of March 2019 half
of SME broadband sales came with
4GAssure.
• We created a team dedicated to partnering
with innovative converged technology
companies to introduce new content,
smartphones and smart home technology.
• Since EE launched shared data plans
there have been more than three million
data gifts between customers.
a
Superfast bre broadband refers to bre-to-the-cabinet (FTTC). Ultrafast broadband refers to bre-to-the-premises (FTTP) and Gfast.

20
BT Group plc Annual Report 2019
Strategic progress
Creating a simplied, leaner and more agile business
This year we have continued to focus on
modernising our organisation, to put customers
at the heart of what we do.
We simplied our structure by bringing
together our Consumer and EE
businesses and our Business and Public
Sector and Wholesale and Ventures
businesses to create two new customer-
facing units – Consumer and Enterprise.
Our specic focus areas are:
We are changing our culture to bring
it more in line with the dynamic
company we want to be. That includes
changes to the way we manage
performance, our job categories
and inter-team working.
4
Number of customer-facing
units reduced from six last year
67%
Around 67% of our spend is
with our top 100 suppliers
3. Strategic sourcing
£875m
Overall cost savings from our cost
transformation programme are currently
an annualised benet of £875m with
an associated cost of £386m
4,029
Roles removed in the year through
our cost transformation programme
1. Simplifying products,
processes and systems
2. Building a more modern,
productive operation

21
BT Group plc Annual Report 2019 Strategic report
Governance
Financial statements
Additional information
To transform our business we need a simpler,
atter and more modern organisational
structure. This means having broader, more
accountable roles; fewer job levels; market-
aligned pay; and clearer career paths that
support individuals’ development.
Last year we committed to reshaping our
workforce by reducing roles in the UK and
overseas by 13,000 over the next three
years, with a focus on senior and middle
management roles and by getting smarter
about how we operate.
We are on track against our restructuring
plans with reductions in senior management
balanced with hiring in our front lines –
engineers and contact centres. This includes
hiring more apprentices into Openreach to
resource our integrated network and bre
rollout programmes.
In contact centres, we are recruiting more
people to help improve the experience of our
customers when they get in touch with us.
Balancing the reductions in management
roles with the increases in contact centre and
engineering roles will leave a net reduction of
around 7,000 roles by March 2021.
We are working with our people to ensure
those aected by changes are supported
through the change process.
We are one of the biggest private sector
recruiters of apprentices in the UK by a
signicant margin. We are also popular –
last year there were 63,000 apprentice
applications for almost 4,000 places.
We aim to reshape our workplaces to make
working for BT feel more like working for a
modern technology company. We have started
to roll out a more open working culture. This
includes more teams working in the same
buildings to boost productivity, innovation
and inter-team working, supported by a wider
range of collaborative software.
We are also speeding up ways of working.
This means quickly bringing together teams
for specic projects, then dissolving them
when the project has nished. We are also
letting people work in more uid ways,
encouraging more collaboration and cross
functional working than we had before. We
are creating more opportunities for people to
test, learn and try again.
We have around 7,000 properties in the UK
and 1,678 across the rest of the world. We
lease most of our UK properties from Telereal
Trillium, part of the William Pears group. We
signed a sale and lease back arrangement
with them in 2001. Eighty-seven per cent
of our UK properties are operational sites
housing xed and mobile telecoms and
broadband kit. These are retail outlets, oces,
contact centres, depots and data centres. We
also have BT Sport TV studios in London.
To enable these new working practices, we
are creating and investing in more modern,
t-for-purpose oce environments. For
example, we are focusing on around 30
modern, strategic sites to create a more
collaborative, open and customer focused
working culture.
We recently carried out a review of the
structure, composition and operation of our
Board committees to speed up executive
decision making and improve overall
governance. Changes were approved and
implemented by the Board in April 2019.
For further information please see page 56
of the Governance report.
1. Simplifying products,
processes and systems
Our large portfolio of products and services
is complicated for customers and is resource-
intensive to support.
We are starting to simplify our products
and services and streamline our IT systems
and processes. This will reduce additional
work and duplication and help us keep our
promises to customers more quickly and
reliably. It will also give us a springboard to
become the ecient business we need to be
to thrive in the future.
Simplifying operations progress around BT
• We brought together our Consumer and
EE businesses, integrating teams under a
new multi-brand operating model.
• We integrated our Business and Public
Sector and Wholesale and Ventures
businesses into Enterprise to strengthen
services and products and help customers
move to converged technologies.
• Global Services restructured its operating
model to create a new sales organisation
around three global industry verticals,
supported by a single, global commercial
unit. This will give us deeper focus
on fewer customers, improving their
experience of doing business with us.
2. Building a more
modern, productive
operation
We know that becoming more ecient
will make us more productive in the future,
better able to oer a truly dierentiated
customer experience.
To do that we need a smaller workforce in
some areas and a larger one in others. Our
recent investments in front line contact
centre people and engineers are part of our
plan to put resources, support and decision
making as close as possible to our customers.
To further boost productivity we also need
our people to have better places to work and
better digital skills. These will enable much
greater customer focus.
Productivity progress
• Our better workplace programme
is reducing the number of sites and
upgrading those that remain.
• Our cost transformation programme
remains on track, with c4,000 roles
removed in the year.
• Overall savings from our cost
transformation programme are currently
an annualised benet of £875m with an
associated cost of £386m.
• Outsourcing of our UK and Republic
of Ireland facilities management and
projects and construction teams took
eect on 1 April 2019. This has resulted
in approximately 1,900 employees
transferring out of BT.
• Openreach is committed to achieving a
world-class cost base to underpin our
bre build and has integrated key network
delivery teams to improve eciency.
• In Global Services we are redesigning our
service and portfolio operations to focus
on the needs of our largest multinational
customers.
3. Strategic sourcing
Through strategic sourcing, we delivered
signicant savings in 2018/19 and we are on
track to deliver more savings in the future.
This approach is changing the way we think
about procurement, which is also helping
suppliers. Thinking earlier helps them
optimise their own supply chains to support
our future plans. This gives everyone more
certainty and cuts back on unnecessary
cost, which in turn improves our customer
experience.
Strategic sourcing programme
• We are further rationalising our supplier
base to reduce risk and cost.
• We are signing better value multi-year
deals with more of a partnering ethos.
• We are working with our suppliers’
suppliers to cut raw material sourcing
costs.

22
BT Group plc Annual Report 2019
Our stakeholders
We rely on our
stakeholders for our
success as we build
the UK’s national
digital infrastructure.
Our main stakeholders are
customers, our people, the
communities in which we do
business, the environment,
shareholders, suppliers,
government and regulatory
bodies.
Customers
We oer our customers the latest
technologies and services to
enable them to communicate,
share, be entertained and do
business. We deliver and support
these products and services to
build valuable, high-quality, long-
term and sustainable relationships.
Our 28 million customer base is integral to
our success. Our customers are consumers,
businesses, multinational corporations,
public sector organisations and other
communications providers.
Some customers are also competitors
because we sell wholesale products and
services to other communications providers
in the UK and overseas.
Everything we do starts with the aim
of delivering a dierentiated customer
experience to generate value and create
loyalty.
You can nd more information on how our
customers t into our business model on
page 12.
People
Our people are central to the
transformation of our business,
and our ability to deliver our vision,
goals and strategic priorities.
We want them to use their skills and our
technology to deliver great products and
services for customers, communities and
societies around the world.
Our people strategy is summed up by our
ambition to be a brilliant place to work. We
want to deliver an outstanding customer
experience by getting our employee
experience right. That means making BT a
place where our people feel engaged and
inspired to be at their best.
At the heart of this are our values:
Personal
Simple
Brilliant
In January’s BT-wide ‘Your Say’ employee
engagement survey, we did better than
previous years on all our value scores:
+3pp
Improvement
in our personal
score (78%)
+2pp
Improvement
in our simple
score (64%)
+3pp
Improvement
in our brilliant
score (73%)
Eighty-four per cent of our people know how
to use our values in their every day work,
which helps us to provide our customers with
a dierentiated customer service.
We know that we still need to do more and
make it easier for our people to make things
happen for our customers. As a result we
have introduced the RAPID
®
(Recommend,
Agree, Perform, Input, Decide) framework.
RAPID
®
helps us be clear about the
accountabilities for key decisions, which
fosters speed, eectiveness and greater
empowerment. We are embedding the
framework through training our leaders
across the organisation in how to use it.
Engaging our people
We are proud that BT people continue to live
by our values – personal, simple, brilliant –
and that their engagement keeps improving.
Our most recent annual engagement survey
in January had an extremely high response
rate of 87% and our year-on-year people
engagement score increased by three
percentage points to 77%.
We tell our people about company results,
major business decisions and other things
that aect them through lots of dierent
channels. Leaders regularly meet their teams
through roundtables, town hall debates, site
visits, webcasts and blogs.
You can nd more information on how we
are reshaping our organisation and ways of
working on page 21.

23
BT Group plc Annual Report 2019 Strategic report
Governance
Financial statements
Additional information
We also listen to our people’s concerns
through more formal engagement with
our European Consultative Council, the
Communications Workers Union, Prospect
and EE employee representatives in the UK.
Building skills for future careers
We are reshaping our workforce prole to
meet the evolving needs of our customers
and the changing technology landscape.
We have continued to invest in
apprenticeships and graduate programmes
in all disciplines, mainly engineering, cyber,
technology and customer operations. We
complement functional skills with front line
and future leader programmes which prepare
our people for people management roles.
We are also focusing on hiring and
developing talent to meet rising demand
for digital and security skills over traditional
telecommunications skills. For example, we
have a Digital Academy in Consumer, we
are building digital media and data insights
teams in Enterprise, and in Global Services we
are developing cloud computing and cyber
skills at scale.
As we transition from PSTN to a modern,
all-IP bre network, we need to develop
dierent skills. In Openreach we are
addressing this increased demand with
our ‘Open Street’ training facilities, which
replicate a complete end-to-end network
– from bre to copper. They also recreate
the homes and streets that our engineers
encounter and provide a safe, real time
environment to master new skills quickly.
For example, ‘real’ scenarios can be created
for students, including blocked ducts, open
joints and intermittent faults. We plan to
invest a further £11m and by 2021 have 11
fully operational Regional Training Centres all
with their own ‘Open streets’.
This is part of our overall focus on improving
digital skills – helping us contribute to the
future success of the digital UK, improve
our customers’ ability to connect, create
demand for our future products and feed
our talent pipeline.
For more information on our digital skills
programmes see page 25.
Supporting our people in their careers
Careers are becoming more exible. Many
of our people want portfolio careers with
dierent phases. Newer generations
recognise that they might work for longer
than their parents but don’t necessarily want
jobs for life; they want to do dierent things
and learn dierent skills.
We are making changes to our culture to
keep abreast of these trends. We are working
to attract and retain a diverse workforce,
invest in our people’s development, promote
their health and wellbeing and help them
save for a better retirement.
As we reshape our workforce we are also
providing a new career philosophy with
greater transparency, clearer choice and a
focus on skills for the future.
We continue in our positive approach to
recruiting and developing disabled talent as
part of our vision to be a disability condent
employer. Our range of support services
and our processes support our managers to
making the necessary adjustments for new or
existing disabled persons within BT.
Health and wellbeing
Employee wellbeing is one of the biggest
contributors to organisational health and
business success. Our aim is to build a team
of engaged, healthy people who are fullled
at work.
Our approach to wellbeing reects this.
We provide access to employee assistance
globally, and we are making it easier for our
people to get mental health support through
early access counselling services. We have
expanded our peer-to-peer scheme and
manager training on mental health both in
the UK and internationally. Our success rate
in getting people with mental illness back to
work has risen to 96.5%.
The support available to our managers
and team members helps us maintain
a low absence rate of 2.36%. We have
strengthened our support in managing and
coping with change to help our people and
managers work through the changes in our
business.
We continue to drive focus on safety and
assurance programmes. Our lost time injury
rate is currently 0.24 working hours per
200,000 working hours, with an increase
against a low baseline impacting the results.
We track incident trends very closely and
have not seen a pattern to the increase but
continue to monitor this monthly.
106,700
We employ 106,700 full-time equivalent
people in 60 countries, 84,300 of whom
are in the UK. We employ an additional
2,000 FTE people through agencies.
16,000
This year, excluding acquisitions, we hired
almost 16,000 people, 12,300 of whom
were UK-based.
4,000
In 2018/19 we took on almost
4,000 new apprentices and more
than 400 graduates.
1,400
We converted just under 1,400 agency
workers to permanent, 800 of whom were
in contact centres.
70%
The average age of our workforce is
reducing with 70% under 50.
14,700
In 2018/19, 14,700 people left the
company. 10,800 left through natural
attrition, and 3,900 through paid leaver
programmes as part of our drive to create
a simple, lean and agile business.
BT people
at a glance

24
BT Group plc Annual Report 2019
Our stakeholders continued
Pay and benets
We regularly review our pay and benets.
Most of our UK-based engineering and
support people’s pay is negotiated through
collective bargaining with our recognised
trade unions. This means everyone gets
treated fairly. Our managers’ pay ranges
are also set at competitive levels. We work
out bonuses through a mix of business
performance and personal contribution.
Our executives may also get long-term share
awards. These are discretionary and aligned
to the long-term strategy of the company.
What they get is determined by the group’s
performance over a three-year period.
Executive directors must keep hold of those
shares for two more years.
Incentives for Openreach are tied to a
combination of personal contribution
and Openreach’s performance, not Group
performance. And these are paid in cash, not
BT shares.
We support our people through retirement
savings plans, employee share schemes and
country-specic benets.
Volunteering
This year, we took the decision to no longer
focus purely on the proportion of our people
who volunteer, which is why the volunteering
participation rate dropped to 26%. Instead
we will refocus our volunteering eorts on
digital skills – the area we think will deliver
the greatest impact for the UK and BT.
In the year ahead we’ll develop a new target,
that better reects the impact and growing
contribution our people are making through
volunteering. As an example, this year just
over 2,500 of our people contributed more
than 6,700 days supporting digital skills
programmes and helping young people
prepare for the world of work.
Helping people save for a better retirement
Over the past two years we have worked
to change the way our people save for
retirement. This ensures that our pensions
are fair, exible and aordable for all
members and also helps manage our future
risks and costs.
The BT Pension Scheme (BTPS) triennial
valuation process ran in 2017/18. In
2018/19 we concluded our UK Pensions
Review, agreeing the closure of Sections
B and C of the BTPS to future accrual with
members moving into the BT Retirement
Saving Scheme (BTRSS).
For further information on our pension
scheme, see page 145.
Communities
Our communications products,
services, networks and people
are vital to the communities in
which we operate. Our place at
the heart of so many communities
also makes it important that our
business practices are ethical and
transparent.
Our total investment in society in 2018/19
was £28.7m – 0.83% of adjusted prot
before tax. Although this was below our
target of 1%, we remain committed to the
target and have invested £194.9m at an
average of 1.02% over the last ve years.
Going forward, this investment will mainly
be directed towards digital skills. This has led
to some dicult decisions, like the closure
of our fundraising platform, MyDonate, in
June 2019.
Introduced in 2011, MyDonate was the
UK’s rst fee-free platform, but there are
now many other providers in the market.
We’re proud of what we achieved, helping
raise more than £400m over the last nine
years. Butit is now time to lead in another
important area for the UK. Our work with
charities and other partners will increasingly
focus on digital skills. We will continue to
report on our ambition to use our skills and
technology to generate more than £1bn for
good causes by 2020, but it will no longer
be a business priority. Since 2012/13, we’ve
Working to
improve our
diversity
• We are redesigning our
technology apprentice and
graduate schemes to reduce
the risk of selection bias.
• We have active people
networks for Gender,
Disability, Ethnicity, LGBT+
and Neurodiversity. All have
senior sponsors and charters
aligned to our strategy.
• We continue to develop
long-term initiatives such
as TechWomen, furtHER
and STEM Returners to
help the organisation retain
and nurture female talent.
24%
Around 24% of our
workforce (26,100) and
28% of our management
(13,700) are women,
including three out of
11 Board members.
Our workforce includes
around 79,800 men,
with 34,000 of these in
management roles.
12%
Around 12% of our UK
people have a black,
Asian or minority
ethnic background.
5.0%
This year, BT’s overall
median gender pay gap is
5.0%. Our mean gender
pay gap is 5.9%. This is
roughly the same as last
year.

25
BT Group plc Annual Report 2019 Strategic report
Governance
Financial statements
Additional information
used our technology and expertise to help
generate more than £646m for good causes,
including £109m this year.
Digital skills
The UK faces a major digital skills challenge
and we are in a unique position to help
tackle this. We are fundamental to the UK’s
ambition to be a leading digital economy.
We take our responsibilities very seriously –
investing in nurturing the skills needed by
everyone to ourish in the digital world.
Doing so serves a number of our stakeholders
as well as creating the potential for future
demand for our products and helping us to
adapt our workforce.
We’re increasing our eorts with a major
push to encourage and equip our customers
and communities to upgrade their digital
skills and capabilities.
To reect our ambition in this important
area, we have set a target to reach ten million
people in the UK with digital skills training
by 2025. This supersedes our existing target
(to help ten million people overcome social
disadvantage through the benets our
products and services can bring) with a more
focused and measurable programme.
This new target builds on our existing
investment in young people. In a world
where life and work increasingly depend on
technology, giving today’s school children the
right skills will be critical to their success.
Barefoot Computing, our partnership with
BCS, the Chartered Institute for IT, operates
in around 60% of UK primary schools and
helps young people (aged ve to 11) develop
their computational thinking skills as part of
the computer curriculum. BT volunteers have
helped to train more than 70,000 teachers.
Through them, Barefoot has reached more
than two million children since 2014.
BT has become the rst strategic partner
of the new National Centre for Computing
Education (NCCE). This initiative from the
Department for Education is designed to
improve the reach and quality of computing
teaching across England. Among other
things, we’ll be bringing Barefoot to the
heart of the NCCE’s oer for primary schools.
Championing human and digital rights
We’re committed to respecting everyone’s
basic rights and freedoms – both online and
oine. The nature of what we do means we
must protect customers from online harm,
safeguard their privacy and security and
support their right to free expression. Our
Digital Impact & Sustainability Committee
, a
board committee, oversees our human and
digital rights programme.
This year we launched a new overarching
human rights policy, and reported on modern
slavery, privacy and freedom of expression.
We collaborate on privacy and free expression
challenges through the Global Network
Initiative.
We want to lead the way in tackling modern
slavery through technology. This year we
co-founded and launched Tech Against
Tracking, a coalition of organisations
including Amazon, Vodafone, AT&T,
Microsoft, Nokia, Salesforce and anti-
tracking experts, to work together on
the challenge. We also partnered with the
UK charity Unseen to extend the reach of
the UK Modern Slavery Helpline through a
smartphone app.
We comply with the Modern Slavery Act and
follow international standards on human
rights, such as the International Labour
Organisations Principles and the UN Guiding
Principles on Business and Human Rights.
We have contractual standards on working
conditions to avoid forced labour. We also
have processes in place to assess the risks of
our suppliers not meeting these conditions.
We work with EcoVadis and the Responsible
Business Alliance to inform our assessments.
We will follow up with our suppliers on any
improvements needed. For higher risk sites of
concern, we go to see the working conditions
for ourselves.
For more information on human and digital
rights, see btplc.com /digitalimpact and
sustainability/humanrights/modernslavery
What the
digital skills
gap means
for the UK
Boosting digital skills and inclusion
• We’re helping SMEs with digital skills,
through initiatives including workshops
run by BT Sport and Google
Digital Garage. We held 11 workshops
and coached over 1,000 BT Sport
commercial customers to enhance their
online proles.
• Our BT furtHER programme in
partnership with ‘Code First: Girls’
is a free full-time digital intensive
programme that gives women the
opportunity to move into a technical
career. Twenty-one women from the
rst programme have transitioned into
software developer roles in technology.
• EE partnered with ‘Action On Hearing
Loss’ to give mobile plans and service to
the one in six people in the UK who have
hearing loss.
• We’ve partnered with the British Asian
Trust in India on a programme that aims
to empower 500,000 adolescent girls
through technology and education.
• Our funding and technical expertise
is helping Jān˙gala, a tech start up,
develop easy to deploy wi- systems for
refugee camps and in a wide range of
humanitarian situations in Italy, Serbia
and the UK.
65%
The percentage of
children starting
school today who
will have jobs that
don’t yet exist.
11.3m
The number of
adults who lack
basic digital skills.
3 in 4
The number of UK
businesses who
report internal
digital skills gaps.
£63bn
The estimated
annual impact
of the digital
skills gap on
the UK’s future
competitiveness.
The above data has been drawn from external sources.

26
BT Group plc Annual Report 2019
Becoming
a net zero
carbon
emissions
business
In October 2018 we pledged to become
a net zero carbon emissions business by
2045. This extends our 1.5° C science-
based target to reduce the carbon
emissions intensity of our operations
by 87% by 2030 (against a 2016/17
baseline). There are three main areas we
are focusing on to achieve this:
• purchase 100% renewable electricity
worldwide by 2020 where markets
allow. We are currently at 87%.
This year, we agreed new contracts
to power EE’s mobile network with
renewable electricity meaning that
in the UK, 100% of our directly
purchased electricity is now from
renewable sources
• convert our eet to ultra-low
emissions vehicles
• decarbonise our buildings.
Our stakeholders continued
The environment
Our products, supply chain and
operations all have an impact on
the environment. We are taking
a leadership role in tackling
climate change and have a target
to become a ‘net zero’ carbon
emissions business by 2045.
The Intergovernmental Panel on Climate
Change report published in October 2018
has underscored the importance of urgently
tackling climate change. We continue to
work in areas we control, while also being
active in driving change with our customers,
suppliers and other stakeholders.
Cutting our emissions and energy use
This year our energy consumption dropped
by 2.24% and we reduced our total end-
to-end worldwide CO
2
equivalent (CO
2
e)
emissions by 7.4%.
We have saved around £298m since 2009/10
through more ecient cooling systems,
modernising data centres, optimising our
networks, introducing LED lighting and
installing energy management systems. This
year we celebrate our tenth year of investment
in energy reduction programmes, through
which we have consistently delivered energy
Our worldwide greenhouse gas emissions
a
Our COe emissions
Year ended 31 March
Year ended 31 March
2017 2018
0
2,000
1,000
3,000
4,000
5,000
6,000
CO
2
e
Ktonnes
Scope 1 + 2 intensity:
(CO
2
e tonnes per £m value added)
We now include all scope 3 emissions in our reporting.
Figures exclude third-party consumption. Scope 2 data
uses market-based calculation. For full methodology and
further data see btplc.com/digitalimpactandsustainability
CO
2
e Ktonnes 2017 2018 2019
Scope 3 4,772 4,387 4,112
114
184
2019
Scope 2 222 193
Scope 1 182 184
4,410
Total 5,176 4,764
23
31 29
Scope 1: Direct emissions from our own operations
(eg fuel combustion).
Scope 2 : Indirect emissions from the generation of our
purchased energy (mainly electricity).
Scope 3: Including supply chain, customer use of our
products, and other indirect emissions
(such as employee commuting).
5,176
4,764
4,410
a
We restate previous years’ data when we think subsequent
information is materially signicant (eg replacing estimates
with measured gures).
Our worldwide energy use
Year ended 31 March
2017 2018 2019
0
500
1,000
1,500
2,500
2,000
3,000
GWh
2,880
2,845
2,781

27
BT Group plc Annual Report 2019 Strategic report
Governance
Financial statements
Additional information
consumption savings. There will be further
savings as energy eciency reduces our
environmental impact and plays a part in
overall cost transformation.
Helping customers lessen their impact
Our products and services help our
customers reduce carbon emissions – for
example, through avoiding travel and
becoming more ecient.
Last year our products and services helped
our customers avoid 11.7 million tonnes
of carbon. That is the equivalent of the
carbon emissions of around three million
UK households.
Carbon in our supply chain
The products we sell are manufactured
in our upstream supply chain and we
continue to work with key suppliers to
reduce their carbon impact.
Wider environment aspects
We are reducing plastic waste from our
products and from our operations. We
track this through our Environmental
Management System. Our people are
passionate about reducing plastic use
within BT. More than 4,500 BT people
signed our recent internal plastic pact,
pledging to cut their plastic use at work
and at home.
For more on this, and on other environmental
matters, see our Digital impact and
sustainability report
btplc.com/digitalimpactandsustainability
Shareholders
We have two main shareholder
groups: institutional investors and
individual shareholders. We also
have debt investors.
As a consequence of privatisation in
1984, most of our c829,000
shareholders are individual shareholders,
although institutional investors hold the
biggest volume of shares.
We have an extensive investor relations
programme aimed at keeping existing
and prospective investors informed.
In 2018/19, we held 500 meetings
or events with institutional investors
(2017/18: 450).
This year we reduced our quarterly
disclosures to encourage investors to focus
on longer-term trends.
We keep all shareholders up to date through
regular communications, including the
Annual Report, AGM and our quarterly
nancial and trading statements.
Debt investors
We have an investment-grade credit rating
based on the strength of our balance sheet.
Our relationship with debt investors, mainly
nancial institutions who invest in our
publicly-traded bonds, is key to making
sure we have access to debt capital to
nance our business.
Suppliers
Our thousands of suppliers are
a vital part of our value chain.
Because of our size, we are also a
vital part of theirs.
Our suppliers provide products and services
that help us execute our strategy. We source
from across the world and have suppliers in
nearly 100 countries. Our integrated bre
and 5G network will require signicant
capital investment, and procurement savings
are key to funding this.
We want to know who we’re doing business
with and who’s acting on our behalf, so we:
• choose suppliers using principles that
make sure we act ethically and responsibly
• check that goods and services we buy
are made, delivered and disposed of in a
socially and environmentally responsible
way
• measure factors such as suppliers’ energy
use, environmental impact and labour
standards as well as working with them to
improve these.
We are a signatory of the UK Prompt
Payment Code and support government
initiatives to encourage small business
growth.
£13.4bn
We spent around £13.4bn with
suppliers this year (2017/18:
£13.7bn). This is around 66%
of our costs.
67%
Around 67% of our spend
is with our top 100 suppliers.
52 days
New legislation in 2018 introduced
a duty to report (DTR), requiring the
UK’s largest companies to report on
their payment practices, policies and
performance. Reporting from 1 October
to 31March (H2), BT plc’s average time
to pay invoices was 52 days with 92%
of supplier invoices paid in accordance
with terms agreed with the supplier.
Valuing our
suppliers
Supplier risks
There has been recent commentary on how
national security could be compromised
at the level of some of the foundation
technologies in national communications
networks. Our approach is to focus on
sourcing a range of the best technologies in
the core of our networks, from a wide range
of places.
We also face a continual challenge to ensure
the quality and ethical integrity of our supply
chain. You can read more about our supply-
related risks on page 52.

28
BT Group plc Annual Report 2019
Our stakeholders continued
HM Government
We work with over 1,800 UK
public sector customers and
support critical services in the UK.
Our networks enable vital services, such as
welfare, tax, health and social care, police
and defence, to function – while protecting
citizens’ personal data.
Civil resilience and other obligations
Under the Communications Act 2003, the
Government can ask us (and others) to run or
restore services during disasters.
The Civil Contingencies Act 2004 also states
that the Government can impose obligations
on us (and others) at times of emergency
or in connection with civil contingency
planning.
The Secretary of State for the Home
Department can sometimes also oblige us
to act in the interests of national security.
Our public aairs team is responsible for
relationships with the Government on all
issues of policy. Our Enterprise team is
responsible for selling and maintaining public
sector contracts and services.
Regulators
Communications and TV services
are regulated in the UK and
around the world. Regulation
helps ensure that there are
consistent rules and standards
within each jurisdiction to
protect consumers and promote
competition.
Our main regulatory relationship is with
Ofcom in the UK. Ofcom operates under the
Communications Act 2003, which gave it
its powers and duties and transposed the
EU regulatory framework for electronic
communications in the UK.
Under the Act, Ofcom sets conditions that
communications providers must adhere
to. Ofcom’s main duties in respect of
communications are to further the interests
of citizens and consumers, where appropriate
by promoting competition. In doing so it
must also have regard, where relevant, to the
desirability of encouraging investment and
innovation. Ofcom has general competition
powers for the sector and enforces consumer
law, alongside other economic regulators and
the Competition and Markets Authority.
We aim to be leaders in full bre and 5G,
and launch a UK converged network. This
will benet our customers, as well as the
UK more widely. Our dialogue with Ofcom
focuses on how the regulatory regime can
help its ambition for the UK, while keeping
the market fair and competitive.
In 2018 we implemented the Commitments
we gave to Ofcom to provide Openreach
with greater strategic and operational
independence following its Digital
Communications Review. Ofcom reported
it is broadly satised with our progress. This
included incorporating Openreach Limited
as a wholly owned subsidiary of BT Group
plc, with its own board and greater strategic
independence. It also included completing
the TUPE transfer into the new Openreach
Limited of 31,000 employees from BT plc.
We continue to monitor and provide
assurance to Ofcom on our compliance
with the Commitments. We are currently
working to make our internal processes
and information sharing between BT and
Openreach more transparent.
Future Telecoms Infrastructure Review
In July 2018, the Government published its
Future Telecoms Infrastructure Review which
concluded that the most eective way to
deliver nationwide bre connectivity at pace
is to promote competition and commercial
investment where possible, and to intervene
where necessary. Ofcom’s subsequent
policy documents signalled a shift from
emphasising retail competition to facilitating
competitive investment in full bre.
The Government’s February 2018
consultation on its statement of strategic
priorities for Ofcom reiterates its ambition to
see ‘gigabit capable’ networks available to
15 million premises by 2025 and nationwide
by 2033. This is alongside an ambition to
extend mobile coverage to 95% of the
UK by 2022. This desire to see the UK as a
world leader in digital infrastructure ts with
our desire to invest more, and aligns with
our strategic priority of building the best
converged network.
Consumer regulation
UK regulators have consumers’ interests as
a priority. One area of attention is dierent
pricing between new and existing customers.
We aim to provide all our customers with
great value, with oers that are fair and right
for them. We also help our EE customers
make sure they are on the best value deal by
telling them when it’s time to reconsider their
contracts and oering them alternatives.
We will be implementing end of contract
notications for all of our BT and Plusnet
customers too.

29
BT Group plc Annual Report 2019 Strategic report
Governance
Financial statements
Additional information
Decent broadband for all
The Government has committed to
implement a Universal Service Obligation
for 10Mbps broadband from 2020 and
Ofcom is working to deliver this. It issued a
consultation in December 2018 proposing to
designate BT and KCom as Universal Service
Providers. We are working with Ofcom to
look at how to deliver this eciently and in
a way that provides a good experience for
customers.
Wholesale regulation
In December, 2018 Ofcom issued a
consultation on Physical Infrastructure
Markets and Business Connectivity Markets
setting out how it intends to regulate up to
2021. It has also started consulting on a
clear, predictable and long-term framework
for regulation from 2021 onwards. This
framework envisages longer (ve-year)
market review periods (instead of the current
three-year reviews). On balance, we welcome
Ofcom’s approach, including its shift toward
regulating passive infrastructure where it
enables deregulation further downstream.
In its consultation on Physical Infrastructure
Markets, Ofcom proposes to extend the
existing access obligation applicable to BT’s
ducts and poles, currently limited to mixed
residential and business broadband, to
deployments of any xed networks including
standalone leased lines. The proposal is for
this to start one month after publication of
its nal statement, expected in Q1 2019/20.
We understand the importance Ofcom
attaches to unrestricted ducts and poles
access and have indicated our willingness
to work with Ofcom on the detailed
implementation of the proposals, including
how to ensure a sustainable long-term
pricing regime ahead of the 2021 market
review period.
In its consultation on Business Connectivity
Markets, Ofcom proposed to remove
regulation of legacy business connectivity
products and deregulate additional BT
exchanges and data centres. Ofcom also
proposed to maintain stable wholesale
pricing in these markets to support
investment in full bre. While positive overall,
some of Ofcom’s proposals are less helpful,
for example its proposed obligation on us to
provide dark bre from BT-only exchanges
which in our view is not consistent with the
desire for greater investment nor necessary
to promote competition given passive
infrastructure access. We are continuing to
engage with Ofcom on this and expect it to
say more in 2019.
Spectrum
In the mobile area, 2018’s spectrum
auction gave us the bandwidth we needed
to start rolling out 5G. The next auction is
expected in spring 2020 which we intend to
participate in.
Simplifying regulatory reporting
Understanding the economics of the services
we provide in regulated areas of our business
is important. We are working with Ofcom to
improve our reporting to become relevant,
transparent and more focused in order to get
better quality insight.
EU regulation
Brexit may have a signicant eect on
regulation. Until we know how the UK will
exit the EU, we cannot know what that eect
will be, but we have made contingency plans.
Where we do business in EU countries,
electronic communications networks and
services are governed by directives and
regulations set by European institutions.
These create an EU-wide framework for xed
and wireless telecommunications, internet,
broadcasting and transmission services.
The directives are there to encourage
competition, leading to better investment
in xed and mobile networks, and to protect
consumers. They require independent
national regulators to review markets for
signicant market power regularly and to
put in place fair and proportionate remedies.
They also include rules covering spectrum
authorisation, consumer protection and
universal service obligations.
This framework was updated in 2018 in
the form of a new European Electronic
Communications Code (EECC). We believe
the EECC is largely positive – making it easier
for operators to roll out ultrafast xed and
mobile networks.
Other international regulation
Regulation in international markets varies
widely. This can stop us competing and
providing the services our customers want.
We keep driving incumbent operators around
the world, and their regulators, for fair, cost-
related wholesale access to their networks.
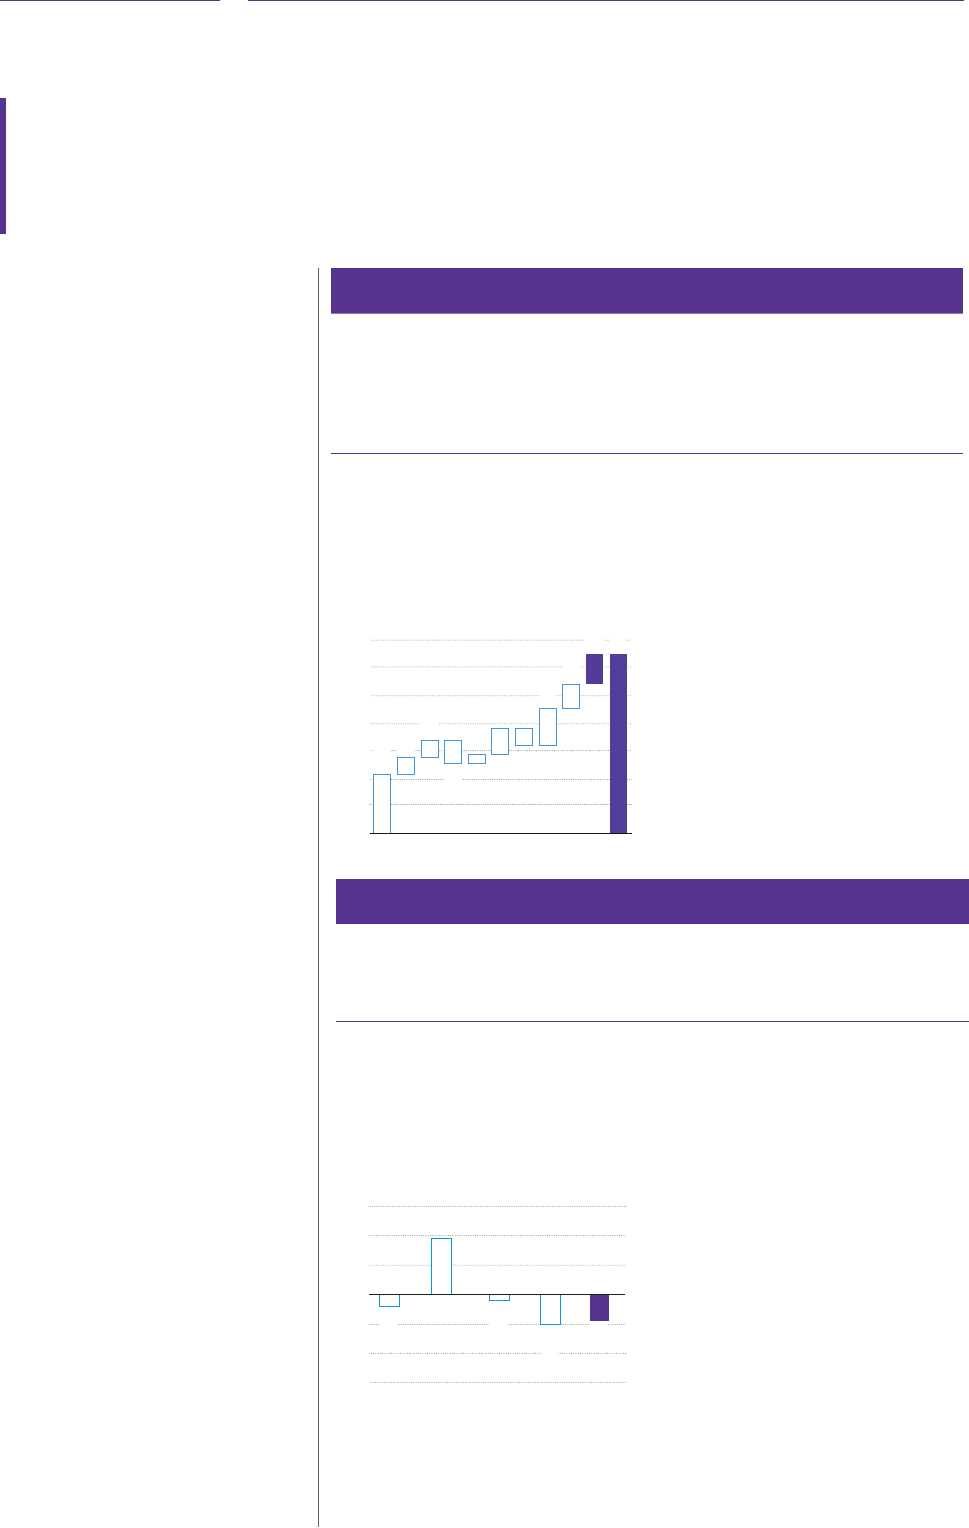
30
BT Group plc Annual Report 2019
Our key performance indicators
We have achieved our customer
experience target for the year, but
want to go further. Our results
were in line with the nancial
guidance we set in May 2018 for
adjusted EBITDA and normalised
free cash ow. We exceeded our
target for change in underlying
revenue. Our capital expenditure
(excluding BDUK clawback) was
slightly ahead of our guidance
as we accelerate our network
investment.
We use four key performance indicators
(KPIs) to measure progress against
our strategy; one non-nancial and
three nancial. Our non-nancial KPI is
improvement in customer service, which is
measured using our Right First Time metric.
Our nancial KPIs are: change in underlying
revenue; adjusted earnings per share; and
normalised free cash ow.
As explained on page 16 we will be
evolving our Right First Time metric for
2019/20 to reect the commitments we
make to customers and providing a more
reliable service. This evolved measure will
be renamed Keeping Our Promises.
We also measure customer experience
through Net Promoter Score (NPS). This
is up 6.5 points from last year and has
improved over 11 consecutive quarters.
From 2019/20 we will be reporting this as
one of our non-nancial KPIs.
As our strategy evolves we will continue to
review these KPIs to make sure they are the
best measures to reect our performance
against our strategy.
Customer service
Right First Time is our main measure of customer service. It tracks how often we keep our
promises to customers. This could be keeping to appointment times, completing orders in
the dened timeframe or xing faults within an agreed period. As well as improving service
and the customer experience, keeping our promises should reduce the work required to x
mistakes, and so reduce our costs.
+5.4%
Right First Time was up 5.4%
(2017/18: up 4.3%).
Improving the service we deliver is key.
We’re making good progress and every
customer-facing unit has improved its
Right First Time score. Despite these
improvements, our strategic priority is to
truly dierentiate ourselves on customer
experience, and we will keep looking for
ways to do that. You can read more about
our dierentiated customer experience
on page 16.
a
Cumulative improvement from 1 April 2009.
Right First Time improvement
a
At 31 March
0
5
10
15
20
35
30
25
%
2010
10.5
4.3
5.4
31.8
2013
(4.0)
2015
4.7
2019
2019
2018
2017
6.4
2012
3.0
2014
1.5
(3.0)
2016
2011
3.0
Change in underlying revenue
Underlying revenue reects the underlying performance of the group that will contribute to
long-term sustainable growth. We exclude the impact of specic items, foreign exchange
movements, acquisitions and disposals.
(0.9)%
Change in underlying revenue was
down 0.9% (2017/18: down 1.0%)
which exceeds our outlook of
down c2%.
Change in underlying revenue was down
as growth in our Consumer business
was more than oset by regulated price
reductions in Openreach and declines
in our enterprise businesses. We explain
more about the performance of our
customer-facing units from page 40.
a
Calculated as though EE was not part of the group
until 1 April 2016.
b
Calculated as though EE had been part of the
group from 1 April 2015.
c
Calculated including the impact of transit,
which is no longer material.
Change in underlying revenue
Year ended 31 March
%
3
2
1
0
(1)
(2)
(3)
2015 2017
b
2016
a
2018 2019
c
1.9
(0.4)
(0.2)
(0.9)
(1.0)
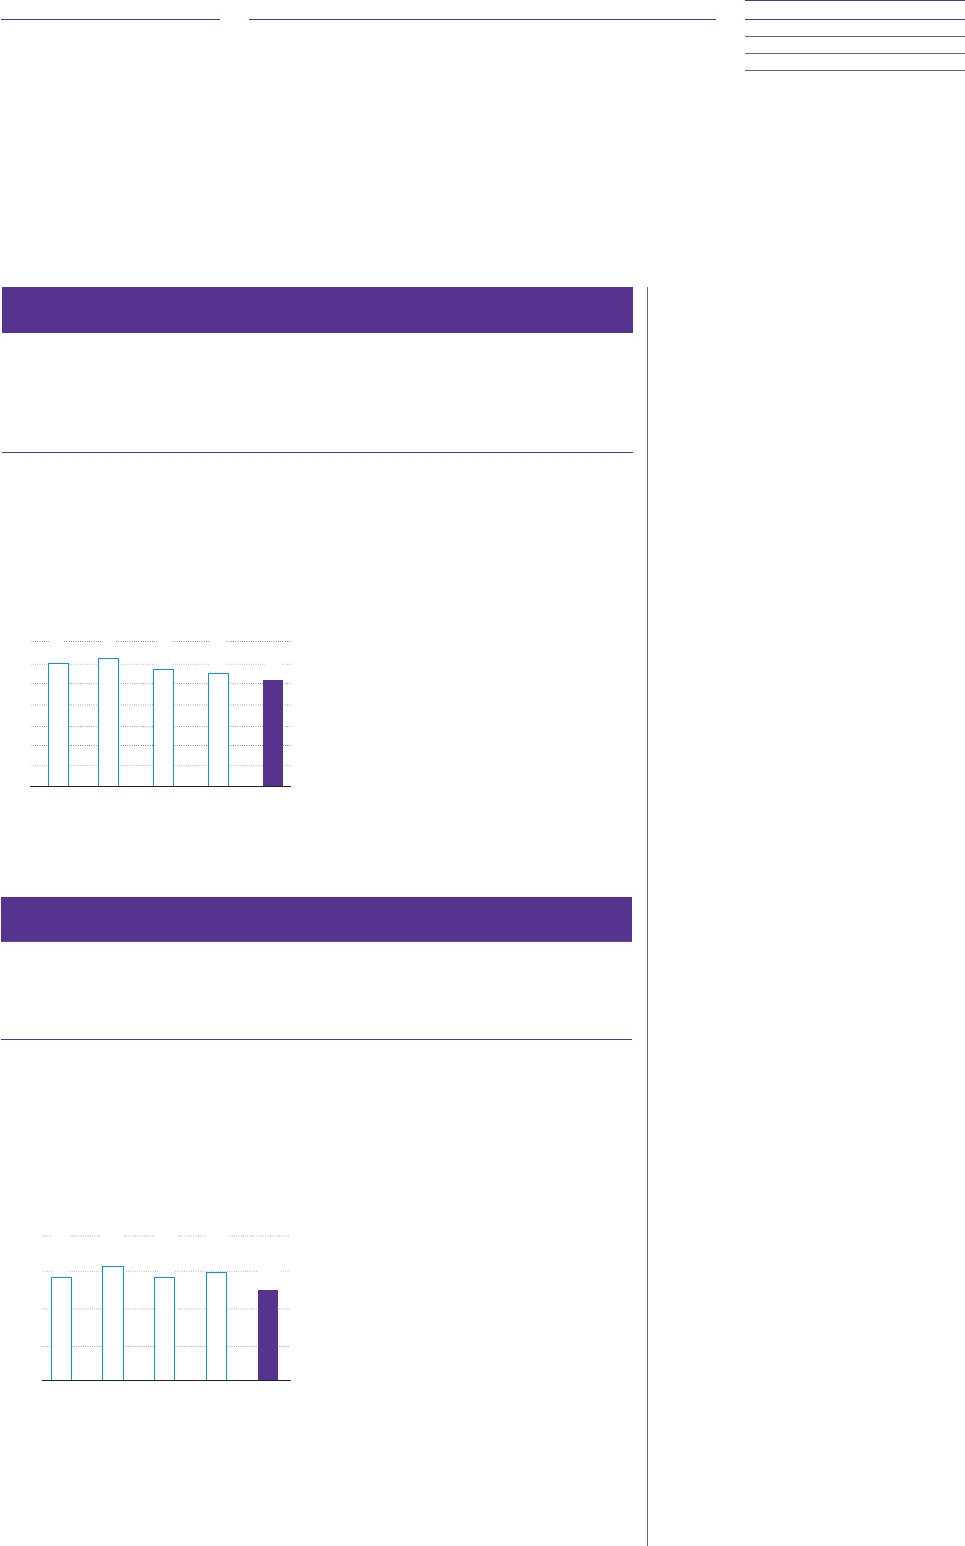
31
BT Group plc Annual Report 2019 Strategic report
Governance
Financial statements
Additional information
Normalised free cash ow
Normalised free cash ow is free cash ow (net cash inow from operating activities after
capital expenditure) after net interest paid, before pension decit payments (including the
cash tax benet of pension decit payments) and specic items.
£2,440m
We generated normalised free cash
ow of £2,440m. This was down
£533m from last year and is in line
with our outlook of £2.3bn to £2.5bn.
The fall of £533m or 18% in our
normalised free cash ow mainly reects
increased cash capital expenditure as
we increase our investment in bre and
5G, decrease in EBITDA and higher tax
payments.
Adjusted earnings per share
Adjusted earnings per share is the adjusted prot after tax attributable to shareholders
excluding the impact of specic items, divided by the weighted average number of
issued shares. This makes it a comparable and consistent way of measuring our business
performance over time.
26.3p
Adjusted earnings per share decreased
6% to 26.3p (2017/18: down 3%
to 27.9p).
Adjusted prot after tax decreased 6%
to £2,611m this year, reecting lower
revenues partly oset by lower payments
to telecommunications operators driven
by Global Services strategy to de-
emphasise low margin business.
Adjusted earnings per share
Year ended 31 March
35
30
25
20
15
10
5
0
2015 2016 2017 2018 2019
pence
30.6
31.8
28.9
27.9
26.3
Normalised free cash flow
Year ended 31 March
0
1,000
2,000
3,000
4,000
£m
2016
2015
2017 2018 2019
2,830
3,098
2,782
2,973
2,440
Alternative performance measures
Reconciliations of these nancial measures
to the closest IFRS measure are set out in
the Additional Information section from
page 185.

32
BT Group plc Annual Report 2019
Our performance as a sustainable
and responsible business
Non-Financial Reporting Information
Statement
Our integrated approach to reporting
means that the requirements of the Non-
Financial Reporting Directive are addressed
throughout the Strategic report. For ease of
reference, information pertaining to each of
the matters addressed by the new regulation
can be found on the following pages: Human
rights (page 25); Our people (page 22);
Social (page 24); Environmental (page 26);
Anti-corruption and bribery (page 32).
For more information on our codes of
practice and employee policies, see btplc.
com/thegroup/policyandregulation/people
For more information on human
and digital rights, see btplc.
com/digitalimpactandsustainability/
humanrights/modernslavery
Additionally, non-nancial matters have
long been embedded in our business model
as stakeholder outcomes on page 13. Non-
nancial performance indicators are linked to
our ambitions and foundation measures as a
sustainable and responsible business and can
be seen in the following table.
Anti-corruption and bribery
We follow local and international law,
including anti-corruption and bribery laws.
The UK Bribery Act and US Foreign Corrupt
Practices Act (FCPA) have extraterritorial
reach, so cover our global operations. We also
have to make sure we follow trade sanctions
and import and export controls.
a
As we direct our resources onto digital skills, we will no longer prioritise our fundraising ambition (by 2020, to use our skills and technology to help generate more than £1bn for good causes)
but continue to report performance on page 25.
b
Revised target introduced to supersede our previous aim (by 2020, to help 10m people overcome social disadvantage through the benets our products and services can bring).
c
Measured for scopes 1 and 2 greenhouse gases.
d
Measures for scopes 1 and 2 greenhouse gases, per unit of gross value added.
e
Senior management team: our top c600 leaders.
Our ambitions
By 2045, to become a net zero
carbon emissions business
c
Our ambitions
a
By 2025, to reach 10m people in
the UK with digital skills training
b
By 2030, to cut our carbon emissions
intensity
d
by 87%, compared with
2016/17 levels
By 2020, to help 5m children
to receive better teaching in
computer skills
By 2020, to buy 100% of our
electricity worldwide from renewable
sources, wherever markets allow
By 2020, to enable customers to
reduce their carbon emissions by at
least three times the end-to-end
carbon impact of our business
2018/19 performance
298,461
tonnes CO
2
e
2017/18: 377,073
Status
>
ongoing target
2018/19 performance
N/A
new ambition
2017/18: N/A
Status
Reporting to start
in 2019/20
2018/19 performance
2m
children reached
2017/18: 1.6m
Status
To be subsumed
into above target
in 2019/20
2018/19 performance
25.7%
reduction achieved
2017/18: 7.1%
(restated)
Status
>
ongoing target
2018/19 performance
2.6:1
achieved
2017/18: 2.4:1
(restated)
Status
>
ongoing target
2018/19 performance
87%
bought from
renewable sources
2017/18: 80%
(restated)
Status
>
ongoing target
Tackling
climate
change and
environmental
challenges
Building
better digital
lives

33
BT Group plc Annual Report 2019 Strategic report
Governance
Financial statements
Additional information
Our ambitions
Employee engagement index:
to maintain or improve our
relationship with our employees
Our ambitions
Societal investment: to be more than
1% of adjusted pro t before tax (PBT)
Our ambitions
Carbon emissions: by 2030,
to reduce our supply chain carbon
emissions by 29%, compared to
2016/17 levels.
Volunteering: by 2020, to inspire
66% (two-thirds) of our people
to volunteer
Gender: By end of 2020/21, we want
40% of our senior management team
e
to be women
Sickness absence rate: to maintain
or reduce percentage of calendar days
lost to sickness
Ethical perception: to maintain or
improve our employees’ perception
of our ethical performance
2018/19 performance
0. 83 %
of PBT invested
2017/18: 1.02%
1. 02 %
5-year average
2017/18: 1.06%
Status
>
ongoing target
2018/19 performance
77%
favourable
2017/18: 74%
Status
3
target met
2018/19 performance
31%
Women on senior
management team
2017/18: N/A
Status
>
ongoing target
2018/19 performance
2.36%
calendar days
lost to sickness
2017/18: 2.30%
Status
5
target failed
2018/19 performance
86%
favourable
2017/18: 83%
Status
3
target met
2018/19 performance
2 6 %
of BT people
volunteering
2017/18: 39%
Status
To be replaced
with new target
in 2019/20
2018/19 performance
7.3 %
reduction achieved
2017/18: 5.1 %
(restated)
Status
>
ongoing target
To nd out more about our progress
in these areas, see: bt.com
/ digitalimpactandsustainability
Investment
in society
Employees Supply
chain

34
BT Group plc Annual Report 2019
Group performance
Introduction from our Chief Financial Ocer
Performance
BT delivered solid results for the year, in line
with our guidance.
Reported revenue fell by 1% to £23.4bn and
underlying
a
revenue was down 0.9% as growth
in our Consumer business was more than oset
by regulated price reductions in Openreach
and declines in our enterprise businesses.
Our reported prot before tax was up 2%
to £2.7bn, reecting one-o EE acquisition
warranty costs in the prior year. Adjusted
b
prot
before tax was down 6% at £3.2bn reecting
the lower revenue partly oset by restructuring
related cost savings and lower payments to
telecommunications operators driven by
GlobalServices strategy to de-emphasise low
margin business.
Our results were in line with the guidance we
set in May 2018 for adjusted
b
EBITDA and
normalised free cash ow
c
. We exceeded our
target for underlying
a
revenue. Our capital
expenditure (excluding BDUK clawback)
was slightly ahead of our guidance due to
acceleration of network investment.
Outlook for 2019/20
BT remains well positioned in a challenging
market. We are taking decisive actions to
further strengthen our competitive position.
Specically, we are increasing investment
to: introduce new customer propositions;
deliver fair, predictable and competitive
pricing; accelerate migration of copper ADSL
to superfast; drive the next step change in
customer experience investment; ramp up FTTP
to 4 million by March 2021; and accelerate 5G
coverage. These actions will impact our outlook.
For 2019/20, we expect adjusted revenue to
be down around 2%. This is mainly as a result of
the challenging market conditions, regulatory
pressure in both xed and mobile markets, and
the ongoing impact from our decision to de-
emphasise lower margin products, particularly
in our enterprise businesses.
Along with the ow through of lower revenue,
we expect our opex investments to result in
Group adjusted EBITDA for 2019/20 being
in the range £7.2bn – £7.3bn. While we will
sustain these opex investments into 2020/21,
we continue to expect Group adjusted EBITDA
for 2020/21 to be above that for 2019/20.
We are raising our reported capital expenditure
guidance (excluding BDUK clawback) for
2019/20 to be in a range of £3.7bn – £3.9bn.
We expect normalised free cash ow for
2019/20 to out-turn in the range £1.9bn –
£2.1bn.
Dividend
We have delivered solid results for 2018/19
and are making positive progress against our
core pillars; to improve customer experience,
to create the best converged network; and to
create a simplied, lean and agile business. This
is being delivered in an increasingly competitive
market environment with a number of
regulatory and other headwinds. We remain
condent in our ability to deliver the benets
we expect from the decisive actions we are
taking to strengthen our competitive position.
As a result, the Board has decided to hold the
dividend unchanged for 2018/19 at 15.4p
per share, leading to a nal dividend of 10.78p
per share. The Board also expects to hold the
dividend unchanged in respect of the 2019/20
nancial year given our outlook for earnings
and cash ow. In line with previous guidance,
our interim dividend for 2019/20 will be xed
at 30% of this year’s full year dividend.
The Board remains committed to our
dividend policy, which is to maintain or
grow the dividend each year whilst taking
into consideration a number of factors
including underlying medium term
earnings expectations and levels of business
reinvestment (which would include the
consideration of accelerated FTTP investment).
Subject to shareholder approval, the dividend
will be paid on 9 September 2019 to
shareholders on the register at 9 August 2019.
The nal dividend, amounting to approximately
£1,069m (2018/19: £1,044m), will be
recognised as an appropriation of the retained
earnings in the quarter to 30 September 2019.
Simon Lowth
Chief Financial Ocer
8 May 2019
Outlook provided
in May 2018 Result
Performance
against outlook
2019/20
outlook
Change in underlying
a
revenue Down c2% Down 0.9% 3
Change in adjusted
b
revenue Down c2%
Adjusted
b
EBITDA £7.3bn–£7.4bn £7.4bn 3 £7.2bn–£7.3bn
Capital expenditure
c
(excluding
BDUK clawback) c£3.7bn £3.8bn 5 £3.7bn–£3.9bn
Normalised free cash ow
d
£2.3bn–£2.5bn £2.4bn 3 £1.9bn–£2.1bn
Alternative performance measures
We assess the performance of the group
using various alternative performance
measures. These measures are not dened
under IFRS so are termed ‘non-GAAP’ or
‘alternative performance’ measures. We
present a reconciliation from these to the
nearest prepared measure in line with
IFRS on pages 185 to 187. The
alternative performance measures we use
may not be directly comparable with
similarly-titled measures used by other
companies.
IFRS 15
IFRS 15 ‘Revenue from Contacts with
Customers’ replaced IAS 18 ‘Revenue’
with eect from 1 April 2018. We present
current year results on the new IFRS15
basis but prior year comparatives on an
IAS18 basis. For this reason, certain
measures may not be directly comparable.
See notes 1 and 2 for further information.
a
Underlying revenue excludes specic items, foreign exchange movements, acquisitions and disposals.
b
Items presented as adjusted are stated before specic items. See page 185 for more information.
c
Additions to property, plant and equipment and intangible assets in the period
d
After net interest paid, before pension decit payments (including the cash tax benet of pension decit payments) and specic items.
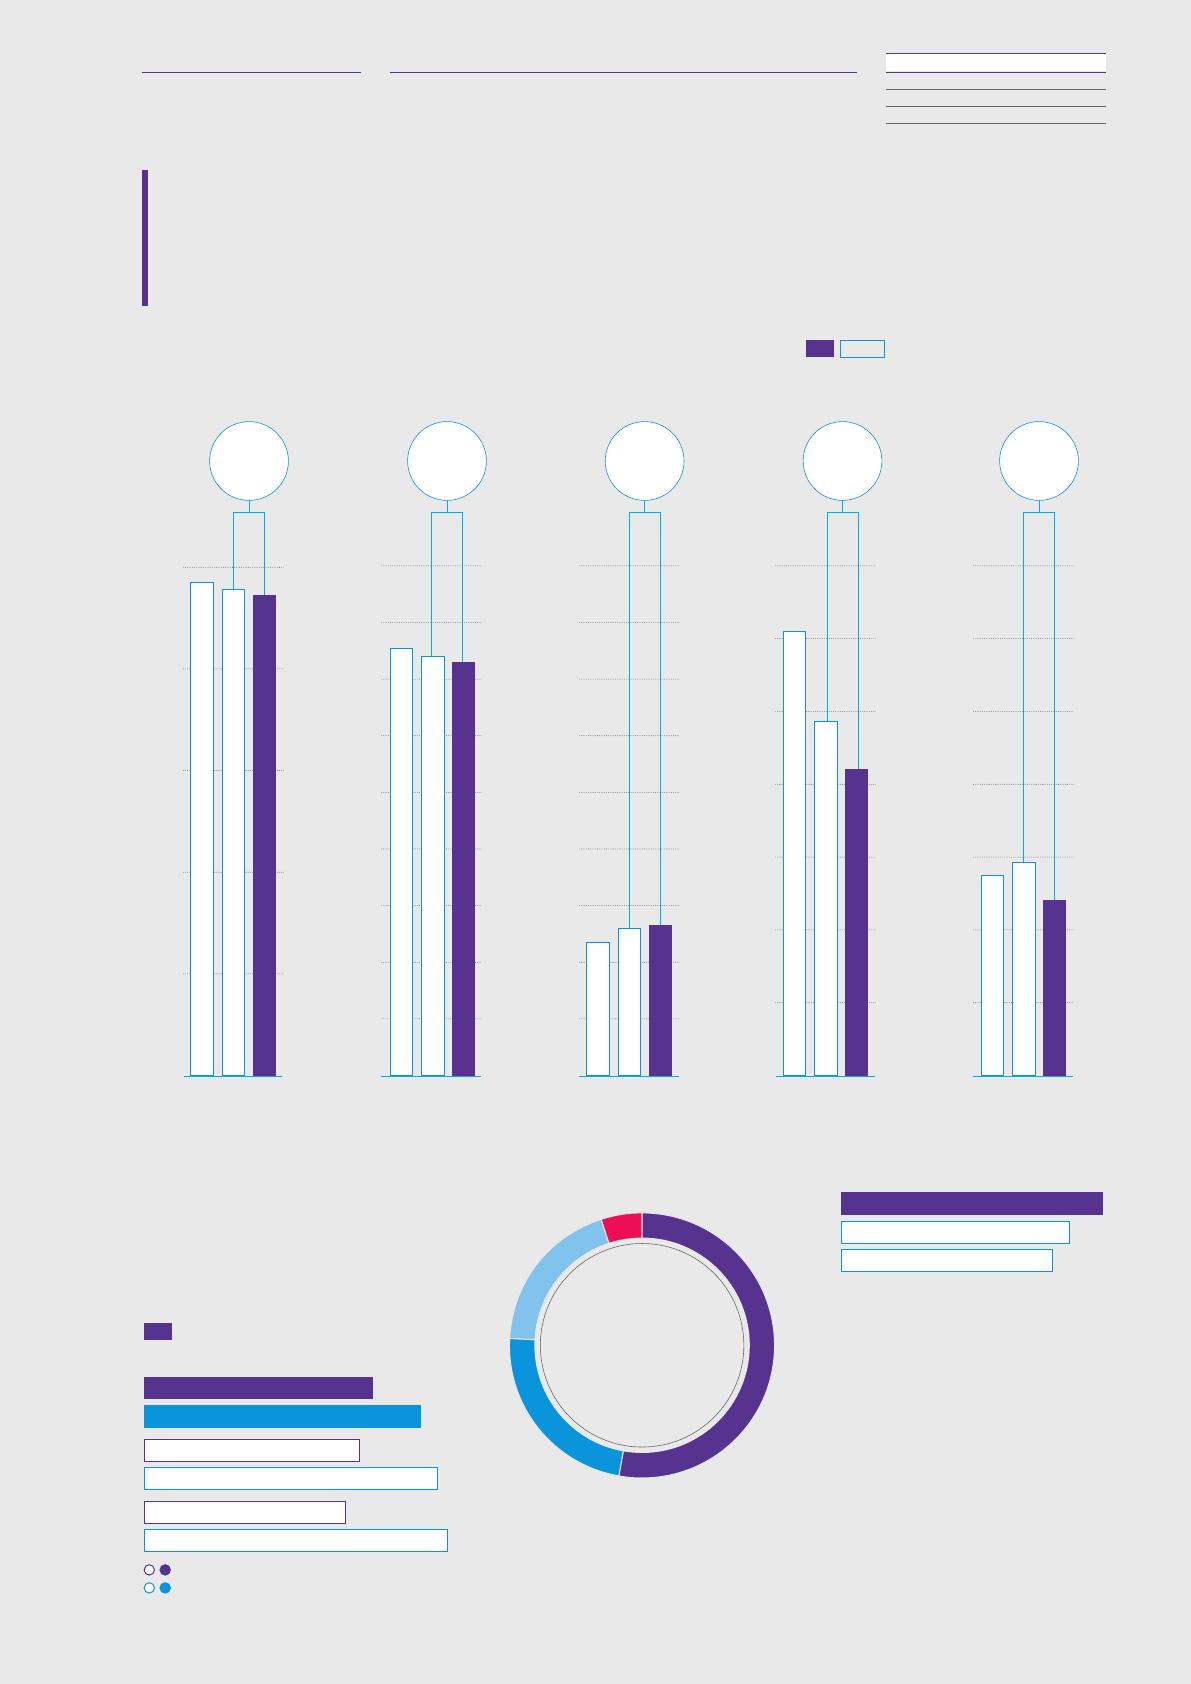
35
BT Group plc Annual Report 2019 Strategic report
Governance
Financial statements
Additional information
Group performance
Summary nancial performance for the year
Year ended 31 March
a
Items presented as adjusted are stated before
specic items. See page 185 for more information.
b
After net interest paid, before pension decit
payments, (including the cash tax benet of decit
payments) and specic items.
2018/19 Capital expenditure Net debt (£m)
2019
11,035
2018 9,627
2017 8,932
KPI
Proposed full year dividend
15.4p
2018: 15.4p
2017: 15.4p
Earnings per share (p)
2019 21.8
2019 26.3
2018 20.5
2018 27.9
2017 19.2
2017 28.9
Reported EPS
Adjusted
a
EPS
1. Capacity and network investment
2. Customer driven investment 23%
53%
3. Systems and IT 19%
4. Non-network infrastructure 5%
1
2
3
4
£3,963m
+13%
Revenue
(£m)
Adjusted
a
EBITDA
(£m)
Prot before tax
(£m)
Operating cash ow
(£m)
Normalised free
cash ow
b
(£m)
KPI BONUS
2017 2018 2019
£m
25,000
20,000
15,000
10,000
5,000
0
23,428
23,723
24,062
(1)%
2017 2018 2019
£m
7,000
6,000
5,000
4,000
3,000
2,000
1,000
0
(14)%
6,174
4,927
4,256
2017 2018 2019
£m
7,000
6,000
5,000
4,000
3,000
2,000
1,000
0
(18)%
2,782
2,973
2,440
2017 2018 2019
£m
9,000
8,000
7,000
6,000
5,000
4,000
3,000
2,000
1,000
0
(2)%
7,645
7,505
7,392
2017 2018 2019
2%
£m
9,000
8,000
7,000
6,000
5,000
4,000
3,000
2,000
1,000
0
2,354
2,616
2,666

36
BT Group plc Annual Report 2019
Group performance continued
Summary nancial performance for the year continued
Summarised income statement
Year ended 31 March
2019
£m
2018
£m
2017
£m
Revenue 23,428 23,723 24,062
Operating costs
a
(16,461) (16,828) (17,323)
Depreciation and amortisation (3,546) (3,514) (3,572)
Operating prot 3,421 3,381 3,167
Net nance expense (756) (764) (804)
Associates and joint ventures 1 (1) (9)
Prot before tax 2,666 2,616 2,354
Tax (507) (584) (446)
Prot for the period 2,159 2,032 1,908
Revenue
Both reported and adjusted
b
revenue fell by 1% as growth in
our Consumer business, was more than oset by regulated price
reductions in Openreach and declines in our enterprise businesses
in particular in xed voice and also reecting our strategy to
reduce low margin activity such as equipment sales. Excluding
the negative impact of £35m from foreign exchange movements,
underlying
c
revenue fell 0.9% (2017/18: fell 1%), which exceeds
our expectation of down around 2%.
You can nd details of revenue by customer-facing unit on pages
40 to 41. Note 6 to the consolidated nancial statements shows
a full breakdown of reported revenue by all our major product and
service categories.
Operating costs
Reported operating costs were down 2% and adjusted
b
operating
costs before depreciation and amortisation were down 1%. This
was mainly driven by restructuring related cost savings and lower
payments to telecommunications operators driven by Global
Services strategy to de-emphasise low margin business, partly
oset by higher costs of recruiting and training engineers to
support Openreach’s ‘Fibre First’ programme and help deliver
improved customer service.
Our cost transformation programme remains on track. c4,000
roles were removed in the year, with the largest elements being in
Global Services and our Corporate Units. Overall savings from the
programme are currently an annualised benet of £875m with an
associated cost of £386m.
Note 7 to the consolidated nancial statements shows a detailed
breakdown of our operating costs.
Prot before tax
Our reported prot before tax was up 2% at £2,666m, reecting
one-o EE acquisition warranty costs in the prior year. Adjusted
b
prot before tax was down 6% at £3,230m reecting the lower
revenue partly oset by the lower costs and higher net nance
expense from increased net debt.
Adjusted
b
EBITDA
Adjusted
b
EBITDA was down 2% at £7,392m, in line with our
expectations. This is primarily driven by revenue decline partly
oset by the lower costs as described above. You can nd details
of adjusted
b
EBITDA by customer-facing unit on pages 40 to 41.
Specic items
As we explain on page 185, we separately identify and disclose
those items that in management’s judgement need to be disclosed
by virtue of their size, nature or incidence (termed ‘specic items’).
Specic items are used to derive the adjusted results as presented
in the consolidated income statement. Adjusted results are
consistent with the way that nancial performance is measured by
management and assists in providing an additional analysis of the
reported trading results of the group.
Specic items resulted in a net charge after tax of £452m
(2017/18: £741m).
During the year we incurred restructuring costs of £386m
(2017/18: £287m), mainly relating to leavers. The costs reect
projects which are part of our group-wide cost transformation
programme, including remaining activities related to the EE
integration.
We have recognised a net charge of £27m (2017/18: £49m)
relating to the completion of the majority of deemed consent
compensation payments, new regulatory matters arising across
a range of issues, including price and service issues, the re-
assessment of other regulatory risks and in light of historical
regulatory decisions by Ofcom.
a
Excluding depreciation and amortisation.
b
Items presented as adjusted are stated before specic items. See page 185 for more
information.
c
Underlying revenue excludes specic items, foreign exchange movements,
acquisitions and disposals.
Adjusted
b
operating costs before depreciation,
amortisation and specific items
Year ended 31 March
(100)
(247)
(43)
78
40
63
16,067
16,241
35
Property & energy
Programme
rights charges
Labour costs
Product costs &
sales commission
POLOs
2018
Network & IT
2019
Other
£m
17,000
16,500
16,000
15,500
15,000
14,500
14,000

37
BT Group plc Annual Report 2019 Strategic report
Governance
Financial statements
Additional information
We have recognised a charge of £36m (2017/18: £28m) relating
to the rationalisation of the Group’s property portfolio, a charge of
£26m (2017/18: £nil) in relation to the high court requirement
to equalise pension benets between men and women due to
guaranteed minimum pension (GMP) and net interest expense
on pensions of £139m (2017/18: £218m). This decreased
from 2017/18 due to the decrease in the BT Pension Scheme
decit over the year to 31 March 2018. We also released £55m
(2017/18: £nil) of provisions following the settlement of various
matters in our Italian business.
The tax credit on specic items was £112m (2017/18: £87m).
Note 10 to the consolidated nancial statements shows the details
of all revenues and costs that we have treated as a specic item.
Taxation
Our eective tax rate was 19.0% (2017/18: 22.3%) on reported
prot and 19.2% (2017/18: 19.5%) on prot before specic items.
We paid income taxes globally of £431m (2017/18: £473m).
We paid UK corporation tax of £317m (2017/18: £374m). We
beneted from £90m of EE’s historical tax losses (2017/18:
£111m) and £391m from tax deductions on employees’ pension
and share schemes (2017/18: £217m).
Our tax expense recognised in the income statement before specic
items was £619m (2017/18: £671m). We also recognised a
£343m tax credit (2017/18: £262m expense) in the statement of
comprehensive income, mainly relating to our pension scheme.
We expect our sustainable income statement eective tax rate
before specic items to be around the UK rate of corporation tax, as
we do most of our business in the UK.
Note 11 to the consolidated nancial statements shows further
details of our tax expense, along with our key tax risks.
Earnings per share
Reported earnings per share was 21.8p, up 6%, while adjusted
a
earnings per share decreased 6% to 26.3p.
Dividends
The Board is proposing a nal dividend to shareholders of 10.78p
bringing the full year dividend to 15.40p, unchanged from
last year. It will be paid, subject to shareholder approval, on 9
September 2019 to shareholders on the register on 9 August
2019. The Board also expects to hold the dividend unchanged
in respect of the 2019/20 nancial year given our outlook for
earnings and cash ow.
Note 13 to the consolidated nancial statements shows details of
the dividends we paid during the year.
Capital expenditure
In recent years we’ve prioritised capital expenditure to underpin our
strategy, and to expand coverage and capacity whilst making our
xed and mobile networks faster and more resilient.
Capital expenditure was £3,963m (2017/18: £3,522m) including
network investment of £2,083m, up 21%. This includes £213m
grant funding deferral under the Broadband Delivery UK (BDUK)
programme, of which £168m relates to a change in base-case
assumption for customer take-up. Excluding the eect of the
grant funding deferral, capital expenditure was £3,750m. The
remaining increase in network investment reects increased spend
on our Fibre Cities programme, partially oset by lower mobile
investment as the Emergency Services Network (ESN) passed the
peak deployment phase. Our BDUK Gainshare provision at the end
of the year was £639m.
Other capital expenditure components were up 5% with £929m
spent on customer driven investments, £747m on systems and IT,
and £204m on non-network infrastructure.
Capital expenditure contracted but not yet spent was £1,432m at
31March 2019 (2017/18: £993m).
Summarised cash ow statement
Year ended 31 March
2019
£m
2018
£m
2017
£m
Cash generated from operations 4,687 5,400 6,725
Tax paid (431) (473) (551)
Net cash inows from operating
activities 4,256 4,927 6,174
Net purchase of property, plant and
equipment and software (3,637) (3,341) (3,119)
Free cash ow 619 1,586 3,055
Interest received 23 7 7
Interest paid (531) (555) (629)
Add back pension decit payments 2,024 872 274
Add back net cash ow from specic
items 598 828 205
Add back net sale of non-current
asset investments 1 19 (20)
Add back prepayments in respect of
acquisition of spectrum licence – 325 –
Remove refund on acquisition of
spectrum licence (21) – –
Remove cash tax benet of pension
decit payments (273) (109) (110)
Normalised free cash ow
b
2,440 2,973 2,782
Cash ow
We generated a net cash inow from operating activities of
£4,256m, down £671m, mainly driven by £2bn contributions
to the BT Pension Scheme, oset by favourable working capital
movements. In line with our outlook, normalised free cash ow
b
was £2,440m, down £533m or 18%, driven by increased cash
capital expenditure, decrease in EBITDA and higher tax payments.
Free cash ow, which includes specic item outows of £598m
(2017/18: £828m) and a £273m (2017/18: £109m) tax benet
from pension decit payments, was £619m (2017/18: £1,586m).
Last year also included payments of £325m for the acquisition of
mobile spectrum. The spectrum auction bidding took place across
the 2017/18 and 2018/19 nancial years. Whilst £325m was
on deposit with Ofcom at 31 March 2018, we went on to acquire
spectrum for a total price of £304m and the excess deposit balance
has since been refunded. We made pension decit payments
of £2,024m (2017/18: £872m) and paid dividends to our
shareholders of £1,504m (2017/18: £1,523m).
The net cash cost of specic items of £598m (2017/18: £828m)
includes restructuring payments of £372m (2017/18: £189m)
and regulatory payments of £170m (2017/18: £267m). Last year
also included payments of £225m relating to the settlement of
warranty claims under the 2015 EE acquisition agreement.
a
Adjusted measures exclude specic items, as explained in the Additional Information on page 185.
b
After net interest paid, before pension decit payments (including the cash tax benet of pension decit payments) and specic items.

38
BT Group plc Annual Report 2019
Group performance continued
Summary nancial performance for the year continued
You can see a reconciliation to normalised free cash ow from
the net cash inow from operating activities, the most directly
comparable IFRS measure, on page 186.
Summarised balance sheet
As at 31 March
2019
£m
2018
(Restated
a
)
£m
Movement
£m
Intangible assets 14,385 14,447 (62)
Property, plant and equipment 17,835 17,000 835
Derivative nancial instruments 1,592 1,509 83
Cash and cash equivalents 1,666 528 1,138
Investments 3,268 3,075 193
Trade and other receivables 3,667 4,331 (664)
Contract assets 1,602 – 1,602
Deferred tax assets 1,347 1,326 21
Other current and non-current assets 925 626 299
Total assets 46,287 42,842 3,445
Loans and other borrowings 16,876 14,275 2,601
Derivative nancial instruments 940 837 103
Trade and other payables 7,269 8,494 (1,225)
Contract liabilities 1,425 – 1,425
Provisions 1,006 1,055 (49)
Retirement benet obligations 7,182 6,847 335
Deferred tax liabilities 1,407 1,340 67
Other current and non-current liabilities 15 83 (68)
Total liabilities 36,120 32,931 3,189
Total equity 10,167 9,911 256
Pensions
The accounting decit, net of tax, increased during the year from
£5.7bn
a
to £6.0bn, primarily driven by an increase in the liabilities
due to a fall in the real discount rate reecting market movements;
partly oset by decit contributions from the group and positive
asset returns. The movements in the decit for the group’s dened
benet plans are shown below:
Key movements in IAS 19 deficit
0.3
3.7
(1.5)
1.2
1.15.7
6.0
(2.1)
Higher than expected
return on plan assets
b
Deficit at
31 March 2019
Costs recognised
in income statement
Contributions from
the group
Deficit at
1 April 2018
(restated)
Increase in liabilities
due to experience and
changes in assumptions
£m
8,000
7,000
6,000
5,000
4,000
3,000
2,000
1,000
0
Net of deferred tax asset Deferred tax asset
Note 20 to the consolidated nancial statements gives more
information on our pension arrangements.
Net debt
c
Net debt
c
increased by £1,408m to £11,035m, mainly reecting
the £2bn of contributions to the BT Pension Scheme in June 2018.
We issued £2bn of bonds to the BT Pension Scheme in June 2018.
We also issued bonds of £2.0bn in September and December 2018
and repaid bonds of £1.4bn maturing in August 2018 and February
and March 2019.
Gross debt translated at swap rates and excluding fair value
adjustments at 31 March 2019 was £15,912m. This comprises
term debt of £15,001m, nance leases of £200m and other loans
of £711m.
a
Certain results have been restated to reect the update to the calculation of our IAS 19 accounting valuation of retirement benet obligations. See note 2 to the consolidated nancial statements.
b
The actual investment return in the year to 31 March 2019 of around 6% was greater than our discount rate assumption at 31March 2018 of 2.65%.
c
Loans and other borrowings (both current and non-current), less current asset investments and cash and cash equivalents. Currency denominated balances within net debt are translated to sterling
at swapped rates where hedged. Fair value adjustments and accrued interest applied to reect the eective interest method are removed. Please refer to note 25 for reconciliation from nearest
IFRSmeasure.
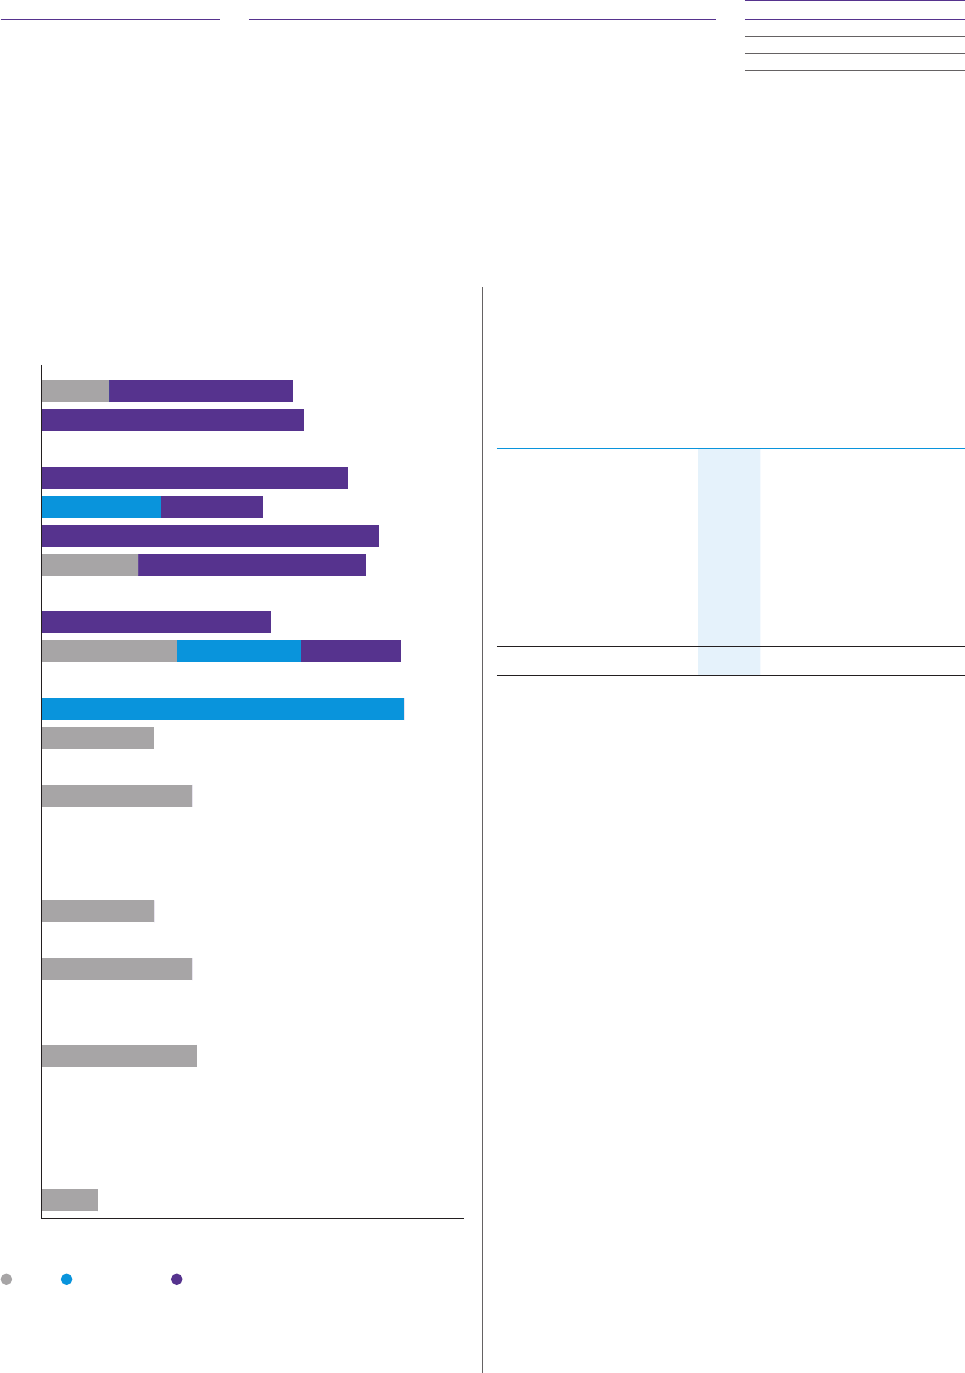
39
BT Group plc Annual Report 2019 Strategic report
Governance
Financial statements
Additional information
The graph below shows our debt maturity prole:
£ debt $ swapped for £ € swapped for £
Note 25 to the consolidated nancial statements gives more
information on our debt arrangements.
Contractual obligations and commitments
We’ve shown in the table below our principal undiscounted
contractual nancial obligations and commitments at
31 March 2019.
As at 31 March 2019
Total
£m
Less
than 1
year
£m
Between
1 and
3 years
£m
Between
3 and
5 years
£m
More
than
5 years
£m
Loans and other borrowings
a
16,624 2,084 1,289 2,396 10,855
Finance lease obligations 202 16 35 31 120
Operating lease obligations 6,619 755 1,240 1,067 3,557
Capital commitments 1,432 1,129 162 141 –
Other commitments 253 253 – – –
Programme rights commitments 2,113 843 1,262 8 –
Pension decit obligations 10,351 1,276 1,817 1,816 5,442
Total 37,594 6,356 5,805 5,459 19,974
a
Excludes fair value adjustments.
We have unused committed borrowing facilities totalling £2.1bn.
We expect that these resources, combined with the future cash we
generate, will allow us to settle our obligations as they are due.
Notes 20, 25 and 30 to the consolidated nancial statements gives
further information on these items.
Share buyback
We spent £9m (2017/18: £221m) on our share buyback
programme. We received proceeds of £5m (2017/18: £53m)
from people exercising their share options.
0 360 720 1,080 1,440 1,800
Debt maturity profile
£m
2020
2021
2022
2023
2024
2025
2026
2027
2028
2029
2030
2031
2032
2033
2034
2035
2036
2037
2038
2039
2040
2041
2042
2043
2044
2045
2046
2047
2048
811300
1,161
1,357
450528
1,492
1,007
1,604
666
686
496
427
598 548 446
1,013
666
498
247
4.3%
2.3%
2.3%
2.8%
2.2%
4.4%
2.5%
3.8%
9.4%
3.2%
3.8%
6.4%
4.0%
4.0%
3.7%

40
BT Group plc Annual Report 2019
Group performance continued
Our customer-facing units
Consumer
2019
(IFRS 15)
2018
(IAS 18)
Change
Year to 31 March £m £m £m %
Adjusted
a
revenue 10,695 10,360 335 3
Adjusted
a
operating costs 8,161 7,984 177 2
Adjusted
a
EBITDA 2,534 2,376 158 7
Depreciation & amortisation 1,024 992 32 3
Adjusted
a
operating prot 1,510 1,384 126 9
Capital expenditure 994 919 75 8
Normalised free cash ow
b
1,323 1,389 (66) (5)
We continue to experience challenging trends in both the high-end
smartphone market and in the broadband market. However, with
leading mobile and xed networks, improving customer experience,
three strong brands and further enhancements to BT Plus, with 5G
coming imminently, we are well placed for the future.
Adjusted
a
revenue growth of 3% for the year was driven by the
continued increase in handset costs for customers, growth in the SIM-
only base across all brands and the impact of price increases, partially
oset by solus voice price reductions.
Adjusted
a
EBITDA grew 7% for the year as the revenue growth was
partially oset by increased trading costs.
Capital expenditure growth of 8% was driven by increased network
spend as preparations were made for the EE 5G launch in 2019.
Normalised free cash ow
b
was £1,323m, down 5% on last year as
the increase in EBITDA was oset by the settlement at the start of the
year of the Phones4U dispute relating to the retail trading agreement,
and increased capital expenditure.
Mobile churn
c
was stable at 1.2% for the year, whilst xed churn
c
was up from 1.3% to 1.4% reecting the impact of price increases
in the year.
Enterprise
d
2019
(IFRS 15)
2018
(IAS 18)
Change
Year to 31 March £m £m £m %
Adjusted
a
revenue 6,292 6,647 (355) (5)
Adjusted
a
operating costs 4,302 4,570 (268) (6)
Adjusted
a
EBITDA 1,990 2,077 (87) (4)
Depreciation & amortisation 634 635 (1) –
Adjusted
a
operating prot 1,356 1,442 (86) (6)
Capital expenditure 501 492 9 2
Normalised free cash ow
b
1,483 1,587 (104) (7)
The UK and Ireland business-to-business market remains challenging.
The main headwind we face is the decline in traditional calls and lines
where we have a relatively high market share. The IP Voice market is
signicantly more fragmented, with a large number of providers, and
we are focused on expanding our share in this growing market. The
mobile market remains competitive and we continue to see pressure on
pricing. While overall growth in the broadband market is limited, we are
seeing good demand for our premium products such as bre and 4G
Assure. Newer areas such as the Internet of Things, Cloud, SDWAN and
security remain good opportunities for us over the longer term.
Adjusted
a
revenue decreased 5% for the year mainly due to the
ongoing decline of xed voice revenue. We continue to see a steeper
than expected reduction in calls per xed line as usage moves to
mobile and IP. We continue to sell less low margin equipment and also
experienced ongoing declines in some of our other legacy products
such as private circuits. This was partially oset by growth in IP, Mobile
and Networking. We’re also continuing to see encouraging growth in
messaging volumes in Ventures.
Adjusted
a
operating costs reduced 6%, helped by labour cost
eciencies from our cost transformation programmes. Adjusted
a
EBITDA decreased 4%, with our lower cost base more than oset
by the reduction in revenue.
Capital expenditure increased 2% and normalised free cash ow
b
decreased 7%, reecting the reduction in EBITDA and the higher
capital expenditure.
The Retail order intake decreased 15% to £2.9bn for the year due to
the signing of a large contract in Republic of Ireland in the prior year.
The Wholesale order intake declined 22% to £1.0bn after 2017/18
benetted from a number of large deals, including the timing of some
contract renewals.
Adjusted
a
revenue
£10,695m
Adjusted
a
operating prot
£1,510m
Adjusted
a
revenue
£6,292m
Adjusted
a
operating prot
£1,356m
a
Adjusted measures exclude specic items, as explained in the Additional Information on page 185.
b
Free cash ow after net interest paid, before pension decit payments (including the cash tax benet of pension decit payments) and specic items.
c
Number of customers who disconnect from the network, voluntarily or involuntarily, during the period, divided by the average number of customers during the period, presented as a
monthly gure.
d
Enterprise comparatives have been re-presented to reect the bringing together of our Business and Public Sector and Wholesale and Ventures units into a single Enterprise unit, as well
as the transfer of Northern Ireland Networks from Enterprise to Openreach.

41
BT Group plc Annual Report 2019 Strategic report
Governance
Financial statements
Additional information
Global Services
2019
(IFRS 15)
2018
(IAS 18)
Change
Year to 31 March £m £m £m %
Adjusted
a
revenue 4,735 5,013 (278) (6)
Adjusted
a
operating costs 4,230 4,579 (349) (8)
Adjusted
a
EBITDA 505 434 71 16
Depreciation & amortisation 370 424 (54) (13)
Adjusted
a
operating prot 135 10 125 1,250
Capital expenditure 245 278 (33) (12)
Normalised free cash ow
b
296 118 178 151
Global Services operates in a global market that continues to
experience high levels of change driven by both rapid technology
innovation and a dynamic competitive landscape. Customers’
demands continue to evolve towards more exible, on-demand
models and new cloud-based and software-dened networking
solutions. We continue to execute our Digital Global Services
transformation programme to focus our business, standardise our
operations, transform our underlying infrastructure, and provide
innovative solutions to address the changing demands of our
customers. We are focused on around 800 multinational companies
and nancial institutions served by three global industry verticals.
Adjusted
a
revenue for the year was down 6%, in line with our
strategy to de-emphasise low margin business and including the
impact of divestments. This includes a £35m negative impact
from foreign exchange movements, primarily reecting lower IP
Exchange volumes and equipment sales.
Adjusted
a
operating costs for the year were down 8% mainly
reecting the decline in IP Exchange volumes and equipment
sales and lower labour costs from our ongoing restructuring
programme. Adjusted
a
EBITDA for the year was up £71m reecting
the reduction in operating costs and certain one-os, more than
osetting the impact of lower revenue.
Depreciation and amortisation was down 13% for the year due to
closure of certain projects in the prior year.
Capital expenditure was down 12% for the year reecting
ongoing rationalisation and our strategy to become a more asset
light business. Normalised free cash ow
b
for the year improved
by 151% to £296m, reecting higher EBITDA, lower capital
expenditure and improved working capital.
Total order intake was £3.3bn, down 15% year on year continuing
to reect a shift in customer behaviour, including shorter contract
lengths and greater prevalence of usage-based terms.
Openreach
c
2019
(IFRS 15)
2018
(IAS 18)
Change
Year to 31 March £m £m £m %
Adjusted
a
revenue 5,075 5,278 (203) (4)
Adjusted
a
operating costs 2,652 2,663 (11) –
Adjusted
a
EBITDA 2,423 2,615 (192) (7)
Depreciation & amortisation 1,468 1,401 67 5
Adjusted
a
operating prot 955 1,214 (259) (21)
Capital expenditure 2,081 1,699 382 22
Normalised free cash ow
b
685 1,100 (415) (38)
Openreach has a UK-wide presence which is overlapped by our
competitors in around half the country. This overlap is expected
to grow as alternative network providers build-out new bre
footprint. Our volume discount deal, signed with the majority of
our major communications provider customers, has led to another
record quarter for bre sales. We are also rapidly expanding our
bre-to-the-premises network to provide the next generation of
services for our customers. We have experienced strong demand
from businesses for Ethernet circuits for the second consecutive
quarter.
Adjusted
a
revenue decline of 4% for the year was driven by
regulated price reductions predominantly on FTTC and Ethernet
products, non-regulated price reductions (mainly driven by
communications providers signing up for bre volume discounts), a
small decline in our physical line base and a reclassication of costs
to revenue. This was partly oset by 25% growth in our bre rental
base, a 9% increase in our Ethernet rental base and the impact of
adopting IFRS15.
Adjusted
a
operating costs were broadly at, with higher costs
from recruiting and training engineers to support our ‘Fibre First’
programme and help improve customer experience, as well as
pay ination and business rates, oset by eciency savings and a
reclassication of costs to revenue. Adjusted
a
EBITDA was down
7% for the year.
Capital expenditure was £2.1bn, up 22%, driven by investment in
our FTTP and Gfast network build and higher year-on-year BDUK
net grant funding deferrals, partly oset by eciency savings.
Normalised free cash ow
b
was down 38% due to the EBITDA
decline, higher underlying capital expenditure (excluding BDUK
grant funding deferrals) and timing of customer receipts.
Adjusted
a
revenue
£4,735m
Adjusted
a
operating prot
£135m
Adjusted
a
revenue
£5,075m
Adjusted
a
operating prot
£955m
a
Adjusted measures exclude specic items, as explained in the Additional Information on page 185.
b
Free cash ow after net interest paid, before pension decit payments (including the cash tax benet of pension decit payments) and specic items.
c
Openreach comparatives have been re-presented to reect the transfer of Northern Ireland Networks from Enterprise to Openreach.

42
BT Group plc Annual Report 2019
A message from the
Openreach Chairman
Openreach has had a solid year
of progress. We improved our
customer service performance,
confi rmed our status as a legally
separate entity, and accelerated
our full fi bre build programme
through major investments in
our people and our network.
Investing in our service and people
Our network is more than 173 million
kilometres long and passes nearly 32
million homes and businesses. With so
many customers, improving the service we
o er will always be our top priority.
I am encouraged by the progress we’re
making in reducing faults, keeping missed
appointments down and xing issues much
faster. Last year we cut the total number
of faults on our network by 4.4% – saving
some 194,000 engineer visits . Th is is
helping us continue to meet or exceed all of
Ofcom’s 42 Minimum Service Level targets
on copper and broadband services.
On the dedicated circuits we provide for
businesses, we delivered another strong
year of Ethernet orders and we are also
xing 94 % of faults within just ve hours.
We also opened more direct
communication with end customers, via
our website and social media, to tackle the
frustration some face in contacting us.
But we know we need to do better, because
what we do is so important to the UK’s
citizens and businesses.
We’re continuing to invest heavily in our
people, training and systems. This year
we hired 3,500 more trainee engineers
to help us sustain improvements and we
will hire a further 2,700 next year. It is the
biggest recruitment drive in our history.
To consolidate it we have introduced new
training and career opportunities to help
us develop and keep hold of the very best
engineering talent.
We have now opened four bre training
centres, including Peterborough ,
Livingston and Yarn eld. A further eight
similar centres are being built or upgraded
across the country. This 100,000 square-
foot facility includes an ‘ Open Street’ – a
mock-up of a typical suburban street, to
help our engineers develop their skills in an
authentic and immersive environment.
Ful lling our commitments to Ofcom
Following Ofcom’s Digital Communications
Review of 2015, we have implemented a
series of changes to our governance and
operations to give Openreach more control
of its strategy, investments and plans
within a strategic and nancial framework
de ned by BT.
The major milestone this year concerned
our people. On 1 October 2018, more than
31,000 people transferred from BT into the
new Openreach Limited – a considerable
step that we believe is the largest ever
one-o people transfer in UK corporate
history . We also created Openreach
Northern Ireland to complete the formal
implementation of our commitments to
Ofcom under the Review.
Meanwhile, our rebranding programme
continues ahead of schedule. Almost
17,000 vehicles now feature the new
Openreach brand, and we have updated
all our external websites, templates and
systems. Out of 32 Openreach buildings,
we have just seven more to rebrand.
Ofcom recognised the progress we have
made across the board in its most recent
implementation report.
We have completed most of what I call the
‘hard wiring’ necessary to create the more
independent Openreach. The ‘soft wiring’,
encompassing things such as culture and
behaviour, always takes longer to embed.
I am , however, very encouraged at the real
progress that BT and Openreach have made
in this regard. There is a real consensus
throughout both organisations that only by
embedding this new way of working will we
establish an enduring legacy. It takes time
but we are on the right path.

43
BT Group plc Annual Report 2019 Strategic report
Governance
Financial statements
Additional information
‘Fibre First’
FTTP is a vital technology for the UK’s
future. It is fast, reliable and future-proof.
We believe it is key to the future success
of digital services in the UK and we believe
Openreach has to underpin this. That is why
our strategy is ‘Fibre First’.
Last year we accelerated our bre build
programme and doubled our FTTP
footprint. The new network is now available
to more than 1.2 million homes and
businesses. As a result, we are increasing
our aim of reaching three million homes
to four million by March 2021. We are
progressing FTTP build in 26 locations and
in April announced a further 12 locations
to benet from FTTP availability in the
next 12 months, bringing the total to 38.
Around a third of our FTTP footprint today
is in rural areas, and our continuing BDUK
work is almost exclusively focused on FTTP.
We want to go further – to 15 million by
the mid-2020s – if the right conditions
to invest are in place. To help create those
conditions, we are doing whatever we
can to reduce the cost of rolling out bre
– including tools and techniques such as
drones, micro-ducting, ribbonised cables
and ‘plug-and-play’ connections.
We’re also working with the Government
and Ofcom to deliver the enablers we
need to go even further and faster. One
of the biggest of these is business rates
– specically the Cumulo tax on bre
infrastructure. It is a barrier to investment
for any operator wanting to build more
FTTP, and we believe that action on this by
the Government would boost investment
across the sector.
Another hurdle is adoption. Having built
our superfast network to almost 27.5
million premises across the UK, there are
still more than 15.5million homes and
businesses who have not signed up to our
superfast broadband.
That is why last year we took the
unprecedented step of oering volume-
related discounts to encourage more
communications providers to upgrade their
customers. The move is already having a
positive eect on take-up.
We also continue to extend bre into
rural areas – via publicly-subsidised
schemes and direct partnerships with
local communities. We recently signed
our 850th Community Fibre Partnership
contract. Overall the scheme has helped
us upgrade almost 98,000 homes and
businesses in recent years.
Looking to the future
We are committed to openness and
transparency, so we are now publishing a
wide range of information about our ‘Fibre
First’ programme on our website, including
maps and a list of locations we will be
building in over the next 12 months.
We also publish details of the specic
exchanges where we’ve installed, are
currently installing, or will soon be
installing (within the next three months)
FTTP. We will update this information every
three months.
These are exciting times at Openreach.
Wewant to get decent, reliable and future-
proof broadband to as many people as we
can, as fast as we can. I look forward to
seeing that continue to materialise over
the coming year.
Mike McTighe
Chairman, Openreach
8 May 2019
Highlights
173 m
Our network is more than
173 million kilometres long
94%
We are xing 94% of network
faults within ve hours
3,500
In 2018 we hired
3,500 trainee engineers
26
We are progressing FTTP build
in 26 locations
27.5m
We have built our superfast
network to almost 27.5 million
premises across the UK

44
BT Group plc Annual Report 2019
Enterprise Risk Management framework: responsibilities and governance
Our approach to
risk management
Like any business, we face
a number of risks and
uncertainties. Some come
from outside our organisation,
others from within. Some we
can control but others we
can’t, in which case we plan
for the consequences. Many
of our risks are similar to those
faced by similar businesses.
Principal risks and uncertainties
The principal risks and uncertainties that
aect us could have an impact on our
business, brand, customers, assets, revenue,
prots, liquidity or capital resources.
Our Enterprise Risk Management framework
gives reasonable (but cannot give absolute)
assurance that we’ve identied and are
addressing our biggest risks. But there may be
some risks that are either currently unknown,
or currently seen as less important but with
the potential to become more important in
the future.
Events outside BT present both risks and
opportunities. We focus our eorts on
predicting and managing risks while aiming
to take advantage of any opportunities that
may emerge.
We recognise the uncertainty that political
and geopolitical risks present, and have
continued to operate a specic Brexit
programme across BT that looks at how we
might be aected and what our response
should be. This programme has developed
contingency plans covering a range of
scenarios, including the possibility that the UK
leaves the EU without a deal. The programme
continues to follow developments closely
and reports to a steering group chaired
by our chief nancial ocer.
In the section below, we explain what we’re
doing to help prevent our main risks from
materialising, or to limit their impact if they
do. Our principal risks and uncertainties
should be considered alongside our risk
management process, the forward-looking
statements in this document and the
associated cautionary statement (see
page 190).
Customer-facing
and technology unit
leadership teams
Our units follow our Enterprise
Risk Management framework
to manage risks. That means
identifying, responding to,
monitoring and assuring the
key risks aecting their business.
They record the risks for their
leadership teams to review.
Audit and risk committees in our
customer-facing and technology
units, plus corporate functions,
oversee this process.
Executive
Committee
The
Executive Committee
owns and oversees the risk
management process. Signicant
risks are reported and monitored
through the Group Risk Register.
The
Executive Committee
assigns
a senior owner to take charge of
monitoring and managing each
risk. It monitors risks through
detailed reviews of individual
risks as well as six-monthly
reviews of the Group Risk
Register.
Group Risk
Panel
The Group Risk Panel supports
the Board and the
Executive
Committee
.
Every three months
it reviews the Group Risk
Register, which describes our
most signicant risks and how
they are being managed,
considers new or emerging risks,
and recommends ways to tackle
them. It also oversees the work
of the group risk management
function.
Board
The Board has overall
responsibility for making sure
we manage risks appropriately.
It regularly reviews, either
directly or through the
Audit
& Risk Committee
, how we’re
doing across the group, in our
customer-facing and technology
units and corporate functions.
Customer-facing and
technology unit audit
and risk committees
Audit & Risk
Committee

45
BT Group plc Annual Report 2019 Strategic report
Governance
Financial statements
Additional information
How we manage risk
Managing risk is essential if we’re to meet
our objectives, build shareholder value,
become more resilient, maintain our licence
to operate and promote our stakeholders’
interests. To help us, we’ve developed a
group-wide risk management process
with four stages:
Business
activities
Identification
Response
EvaluationMonitoring
Changes over the year
In 2017/18 we improved the way we
manage risk through: revisiting our three
lines of defence model and how we apply
it to our key areas of risk; reviewing our risk
management arrangements against some
external benchmarks; and continuing our
cycle of war gaming. Specic improvements
to our risk and assurance activities in
2018/19 included:
Integrated approach
This year we brought together, under
new management, our risk management,
compliance, internal audit and some second
line assurance functions to manage risk
and provide assurance in a more integrated
and simplied way. To extend and sustain
the benets of this across the organisation,
we’ve launched a new programme called
‘One BT Integrity and Compliance’ – see page
70 for more detail.
Supplier failure
We’ve been reviewing the lessons we learned
following the collapse of a major supplier
during the year, and have made a number of
improvements to how we would pre-empt
and respond to a similar event in the future.
Major contracts
We’ve been reviewing responsibilities
across the three lines of defence for the
management and governance of our
major contracts, and have strengthened
our assurance reporting over key contract
controls.

46
BT Group plc Annual Report 2019
Our principal risks
and uncertainties
Strategic risks
Competition and technology changes
Trend
• Our strategy and business model could be disrupted by technology change and/or
intensifying competition from established players and new entrants into our markets
Potential impact Examples of how we mitigate
• Loss of market share, lower revenues, and prot.
• Products becoming obsolete faster.
• A need for us to invest more.
• We are:
– delivering a dierentiated customer experience to retain
existing customers and attract new customers
– investing in building the best converged network to provide
our customers with products and services that stand out in the
marketplace
– simplifying our business and processes to reduce our cost
base, which is an essential enabler to deliver a dierentiated
customer experience and build the best converged network.
• We’re keeping a close eye on and responding to technology
developments and competitor activity that could have an impact
on us achieving our goals.
Developments in 2018/19
• The UK telecom market struggled to grow.
• Competition increased in the UK as many of our competitors tried
to take more market share.
• Some alternative network providers announced bre network
investment plans in the UK.
• UK sports rights competition increased, with Amazon winning
a three-year broadcast package for the Premier League,
starting in 2019.
• Competitors are developing their future 5G propositions.
Communications industry regulation
• Risk of unfavourable changes to the way we operate and compete where, for
example, Ofcom raises competition concerns around market power
• Also the risk of unfavourable regulatory changes outside the UK to licensing
and terms on which we access incumbent operators’ networks
Potential impact Examples of how we mitigate
• Reduced prices on products.
• Increased costs of doing business due to the service standards
we are required to meet.
• Limitations in the scope and competitiveness of the services
we can provide.
• Our regulatory and policy specialists, legal experts, compliance
and operational teams guard against potential risks and look for
timely opportunities to support the shaping of regulation. This is
underpinned by our regulatory strategy.
• We push for clear, predictable and proportionate regulation,
submitting evidence and analysis into market reviews, charge
controls, disputes and investigations.
• Regular engagement with regulators, government, consumer
organisations and other key stakeholders helps us build trust and
understand their outlook.
• We can ask for judicial reviews of regulatory decisions and appeal
to the Competition Appeal Tribunal, dispute things or complain
against outcomes that we feel aren’t in the best interests of the
market or our customers.
Developments in 2018/19
• Ofcom published Digital Communications Review
Implementation Reports in June and November 2018 reviewing
BT’s and Openreach’s adoption of the Commitments and
Governance Protocol.
• The Department for Digital, Culture, Media and Sport published
its Future Telecoms Infrastructure Review.
• Ofcom continued its cycle of market reviews, including
consultations on the business connectivity and physical
infrastructure markets, and on its move to more holistic
regulation of access across business and residential markets.
• Consumer issues such as charges once a customer’s minimum
contract term expires were part of a super-complaint by Citizens
Advice to the Competition and Markets Authority (across
telecommunications and nancial services sectors) and has been
referred back to Ofcom.
Link to business model
F
I
Link to business model
F
M
Link to strategy
1
3
Trend
Link to strategy
1
2
3
Trend versus prior year indicates our perception
of pre-mitigation risk
Increasing/worsening
Lessening/improving
At a similar level
Link to strategy
1
Best converged network
2
Dierentiated customer experience
3
Simplied, lean and agile business
Link to business model
F
Financial capital
H
Human capital
M
Manufactured capital
I
Intellectual capital
S
Social capital
N
Natural capital

47
BT Group plc Annual Report 2019 Strategic report
Governance
Financial statements
Additional information
Political risk
• Our future strategy and investor condence could be undermined as a result
of an uncertain or adversarial political environment
• Our operations and revenues could be disrupted as a result of geopolitical risk,
in particular outside the UK
Potential impact Examples of how we mitigate
• Direct consequences include impact of movement in foreign
exchange rates, lower consumer and business condence,
cost and availability of capital, interest rates and changes in
tax regimes.
• Political risk can also impact upon some of our other principal
risks, in particular regulation.
• Outside the UK political risk impacts us through changes in
regulation and competition. It could also result in social unrest or
a breakdown in the rule of law, which could lead to a threat to our
people and assets.
• We have strong relationships with the UK Government, key
departments, MPs, peers, the media and business and consumer
bodies. We also engage often and closely with governments and
politicians in the EU and our key global markets.
• We inform public debate around the communications market
with campaigns explaining our role within it.
• In the build up to the UK’s scheduled exit from the EU we’ve
continued our contingency planning to make sure customers
keep getting our services. This includes: making sure we have
enough stock to mitigate any short-term disruption; making
crisis management arrangements in the immediate aftermath of
a ‘hard’ Brexit; reviewing how we’d keep serving EU customers;
assessing what systems we need to change; and making sure our
key suppliers are similarly prepared for any eventuality.
• Outside the UK our public aairs and regulatory teams support
governments and regulators to establish and maintain open and
fair regulation of markets.
• Our security and business continuity teams focus on
protecting our people and assets against the consequences
of geopolitical risks.
Developments in 2018/19
• There were continued negotiations between the EU and UK
to agree Brexit terms – against a backdrop of domestic
political instability.
• There was high political interest and policy focus around
communications – particularly bre broadband and 5G.
The Government’s Future Telecoms Infrastructure
Review concluded.
• There was more political focus on issues like consumer pricing
and contracts, and security and competition in the
communications supply chain.
Financial risks
Pensions risk
• Our dened benet (DB) pension schemes, in particular the BT Pension Scheme
(BTPS), could become more of a nancial burden as a result of future low
investment returns, high ination, longer life expectancy and/or regulatory changes
Potential impact Examples of how we mitigate
• The next BTPS valuation is due at 30 June 2020. A rise in the
decit might aect the size of payments we have to make
into the scheme.
• A rise in the decit could also negatively aect our share price or
credit rating, making it harder and more expensive to
access funding.
• We and the BTPS Trustee regularly review the scheme’s funding
position and investment performance. We also consider
associated risks and possible mitigations.
• Our agreement with the BTPS Trustee following the last funding
valuation helped reduce investment risk and allows for a gradual
move to a low-risk investment approach over time. Our strategy
also aims to mitigate the impact of liability increases (for example
by investing in assets that will go up in value if future ination
expectations rise).
Developments in 2018/19
• The actuarial valuation of the BTPS was agreed in May 2018.
This led to a £2bn contribution in June 2018, funded by
proceeds from issuing long-term bonds to the BTPS.
• We reviewed pension arrangements for our UK people, closing
Sections B and C of the BTPS to future benet accrual on 30 June
2018 (representing more than 99% of active members at the
time). This has largely removed the build-up of additional future
liabilities in the BTPS.
Link to strategy
1
2
Link to strategy
3
Trend
Link to business model
F
H
S
Link to business model
F
H
S
Trend

48
BT Group plc Annual Report 2019
Our principal risks and uncertainties continued
Financial risks continued
Financial risk
• Like many other major international businesses, we’re exposed to
nancial risks such as market risk (including interest rate and foreign
exchange risks), credit risk, liquidity risk and tax risks
Potential impact Examples of how we mitigate
• Interest and foreign exchange rate movements could negatively
aect our protability, cash ow and balance sheets (see note 27
to the consolidated nancial statements).
• If credit risks materialise they could negatively impact our
liquidity and protability.
• If we don’t stick to tax rules we could face nancial penalties
and reputational damage.
• We have a centralised treasury function whose job is to manage
liquidity and funding requirements as well as our exposure to
nancial and market risks.
• Our governance framework is at the heart of how we mitigate
tax risk. This is set and agreed by the Board. We always aim to pay
tax in line with the laws of the countries where we do business.
We want open, constructive relationships with tax authorities
worldwide, getting reputable independent advice where we
need it.
Developments in 2018/19
• Earlier in the year S&P and Fitch downgraded our credit rating,
due to concerns over the eect that competing pressures,
including those related to our pension and our network
investments, may have on our cash ows. The three main
agencies now rate us Baa2/BBB with stable outlook.
• As the external tax environment changes, we have to make
more judgements to forecast the future tax consequences of
business decisions.
Compliance risks
Signicant nancial control failure
• Financial controls may not prevent or detect fraud, nancial misstatement
or other nancial loss
Potential impact Examples of how we mitigate
• Failures in our nancial control framework could result in nancial
misstatement, nancial loss including a failure to prevent fraud,
or key decisions being taken based on incorrect information.
• We train our people (including those in high risk roles) to build
awareness and understanding of controls – including our
three lines of defence, fraud awareness and balance sheet
reconciliation best practice courses.
• We have implemented a nancial controls framework with
appropriate policies, processes, checks and balances – including
quarterly certications over key controls by senior leaders.
• We are progressing a programme to strengthen our nancial
control framework, supported by a new Group Financial Controls
and Assurance team.
Developments in 2018/19
• KPMG have become our new external auditors.
• We have brought together, under new management, our risk
management, compliance, internal audit and some second line
assurance functions.
• We commenced a signicant Sarbanes-Oxley control
enhancement programme which identied two particular areas
requiring remediation: IT general controls and risk assessment,
in particular, documentation of information used in controls.
Although improvements have been made, remediation and
testing of all IT general controls and risk assessment remediation
plans was not complete at 31 March 2019 and will be a
signicant focus for 2019/20. Unremediated deciencies in
the two areas were concluded to be a ‘material weakness’ as at
31March 2019 as dened by the Sarbanes-Oxley Act.
Link to strategy
2
3
Link to business model
F
S
Link to business model
F
Link to strategy
1
3
Trend
Trend

49
BT Group plc Annual Report 2019 Strategic report
Governance
Financial statements
Additional information
Privacy, data protection and data governance
• We might fail to ensure that our customers’ and employees’ data are secure
and protected in compliance with data privacy laws, against internal and
external threats
Potential impact Examples of how we mitigate
• A breach of data protection regulation could result in
enforcement action, signicant nes, class action, prison
sentences and the regulator telling us to stop processing
the data.
• This could also result in potential reputational damage,
stopped operations and nancial loss from nes and
customers leaving.
• We perform compliance reviews of our activities involving
personal data across the business. Our focus is on protecting
systems, enhancing our operational processes and training our
people to protect the personal data they handle.
• We provide our people with tools to make risk-based decisions in
their day-to-day activities (like using Privacy Impact Assessments
when they develop new products or services).
• We conduct due diligence activities on third parties’ data
handling and security arrangements.
• We have Binding Corporate Rules agreed with the regulator to
guide and support our business operations.
Developments in 2018/19
• EU General Data Protection Regulation (EU GDPR) came into
force on 25 May 2018. Our preparations included setting out
in our privacy policies what personal data we collect, what we
do with it and why we process it; reviewing our contractual data
obligations with suppliers; and increasing our resources to deal
with data subject access requests.
• A number of major corporations have fallen victim to signicant
data breaches this year.
Health, safety and wellbeing
Trend
• We might fail to ensure the health, safety and wellbeing of our people or members
of the public, in breach of health and safety laws and regulations
Potential impact Examples of how we mitigate
• Health and safety failures could mean injury to our people or
members of the public, nancial penalties, hindered or stopped
operations and reputational damage.
• We implement a company-wide and Board-endorsed health,
safety and wellbeing strategy.
• All our people do training in basic health and safety, overseen
by their managers.
• We monitor compliance through annual licensing, refresher
training, competency assessments and accreditation for
higher-risk groups.
• We have a new IT system to help us better capture and share
information on health and safety incidents.
• We run wellbeing campaigns for our people.
Developments in 2018/19
• Changes in technology and working processes helped reduce
physical risks to our people.
• Changes in our workforce mean we have more new recruits and
they need more safeguards while they gain experience.
• We’re managing the psychological impact of the pace and scale
of our transformation on our people.
• We’ve appointed a new director of health, safety and wellbeing.
Ethical culture
• Our controls and procedures could fail to detect unethical or inappropriate
behaviour by our people or associates
Potential impact Examples of how we mitigate
• Unethical or inappropriate behaviour could result in fraud or a
breach of regulation or legislation.
• That in turn could expose BT to signicant penalties, criminal
prosecution and damage to our brand and reputation.
• First and second line assurance teams perform risk-focused
thematic reviews in addition to controls monitoring.
• We have policies covering nancial and non-nancial controls
including trade sanctions, conicts of interest, gifts and
hospitality, charitable donations and sponsorship.
• We carry out due diligence on third parties like suppliers, agents,
resellers and distributors.
• We include anti-corruption and bribery clauses in our
procurement contracts.
Developments in 2018/19
• A steady ow of companies being prosecuted under anti-
corruption and bribery laws (UK Bribery Act and the FCPA).
• An increase in legislation to address and report on human rights
abuses by companies.
• An increase in Speak Up (BT’s condential whistleblowing service)
reports and conict of interest registrations.
Link to strategy
1
Link to strategy
1
Link to strategy
1
3
Trend
Link to business model
F
S
Link to business model
F
H
N
S
Link to business model
F
H
S
Trend

50
BT Group plc Annual Report 2019
Our principal risks and uncertainties continued
Operational risks
Customer experience
• Our customer experience may not be brand enhancing nor drive sustainable
protable revenue growth
Potential impact Examples of how we mitigate
• If we don’t deliver a great customer experience it could damage
our brand, cause customers to leave and so reduce our revenue,
or even lead to nancial penalties.
• It could also impact our people’s pride in working for BT.
• We track a range of customer experience metrics very closely and
have programmes in place to drive improvement. For example,
our BT transformation plan includes a radical business process
simplication workstream.
• We’ve launched new and innovative products to further enhance
our customers’ experience, for example, BT Plus.
Developments in 2018/19
• We continued to improve our customer experience, achieving
our best ever customer perception results for BT Consumer, EE,
Enterprise and Global Services.
• Our consumer brands came together under a new Consumer
unit.
• We launched our new Be There brand positioning.
Major contracts
• There is a substantial performance risk to our complex and high-value national
and multinational customer contracts
Potential impact Examples of how we mitigate
• If we don’t meet contractual commitments, or if customers’
needs change, then our expected future revenue, protability
and cash generation may reduce.
• Contracts may even become loss-making through a drop in
revenue, changes to customers’ businesses, business failure or
contract termination.
• We are delivering some particularly high-prole infrastructure
contracts, notably the Emergency Services Network (ESN) and
the Broadband Delivery UK programme (BDUK). If we failed to
deliver these, or had an operational failure, it could lead to major
reputational damage.
• We have governance, risk management and reporting
processes in place at both corporate function and customer-
facing unit levels.
• We have an independent review programme to provide
checks and balances on individual contracts.
• We check how we’re managing contracts against a best practice
framework, based on our knowledge of running and managing
major programmes.
• We also train our contract managers to better identify
and manage risk.
Developments in 2018/19
• We made improvements this year, including:
– learning more about why the performance of some contracts
deteriorates and how to stop it happening in future
– improving the process for management reviewing contracts
– improving long-term forecasting
– improving our contract management systems
and governance processes
– redening and enhancing our controls and assurance.
• On top of deploying the second and third phases of our BDUK
contracts, we continued to win new BDUK work to further
extend coverage of superfast broadband in rural areas.
• We agreed a new ESN contract framework with the Government.
Link to strategy
1
3
Link to strategy
1
3
Trend
Link to business model
H
F
Link to business model
F
Trend

51
BT Group plc Annual Report 2019 Strategic report
Governance
Financial statements
Additional information
Service interruption
• There is a risk we are unable to prevent and respond to incidents caused by natural perils,
network and system faults, and malicious acts that threaten our network
• We may also fail to prevent interruption to our services as a result of supply chain failure,
software changes, equipment faults, re, ood, infrastructure outages and sabotage
Potential impact Examples of how we mitigate
• A major interruption event could result in lost productivity,
rework and recovery costs, loss of revenue, increased insurance
costs, legal or contractual penalties, or even harm to individuals.
• It could also result in customers leaving BT.
• We monitor our IT and network performance very closely, and
have controls in place to limit interruption to service.
• Our mobile, geographically dispersed, emergency response
facilities help us manage incidents if they do occur.
• We are continuing our programme of providing permanent ood
protection for our critical assets most at risk.
• We test our resilience through a number of activities, including a
continual cycle of war gaming.
• We review the lessons learned from major incidents in order to
try to prevent such things from recurring.
Developments in 2018/19
• Extreme weather always challenges our IT and network estate.
This year we had to keep our network operating through the joint
hottest UK summer on record, lightning storms and heavy rain.
• We’ve particularly focused on technology lifecycle management
to recognise and manage the risks associated with our systems
estate over time.
Cyber and information security
• Security risks could arise from people inside BT or from external sources like
hacktivists, criminals, terrorists or nation states attacking our infrastructure
and assets, for example through use of hacking tools, phishing scams and
disruptive malware
Potential impact Examples of how we mitigate
• A cyber attack could result in disruption to our business or
data being compromised, leading to nancial loss, long-term
reputational damage, loss of market share, regulatory sanctions,
nes and contract penalties or termination.
• It could also result in missed opportunities to grow revenue
and launch new services ahead of our competitors.
• We monitor and log our network and systems, and keep raising
our people’s security awareness through training and mock
phishing attacks.
• We have compartmentalised our IT estate as we provision
new cloud-based systems to limit the potential impact of a
cyber attack.
• ‘Red Team’ exercises run by our ethical hackers help us to keep
improving security across BT, especially around upgrading our
access controls.
Developments in 2018/19
• Major corporates continue to fall victim to cyberattack, with a
number of high-prole incidents occurring in 2018/19.
• EU GDPR came into force on 25 May 2018.
Trend
Trend
Link to strategy
1
Link to strategy
1
2
Link to business model
F
I
M
N
Link to business model
F
I

52
BT Group plc Annual Report 2019
Operational risks continued
Supply chain
• There is a risk of disruption to the integrity and continuity of our supply chain
• Global markets expose us to global supply chain risks. These include dierent labour
standards and environmental and climate change practices, increasing regulation
and geopolitical events
Potential impact Examples of how we mitigate
• The impact of suppliers failing can vary. If substituting a failing
supplier meant we had to disrupt our business, it could cost us a
lot of time and money.
• If we couldn’t nd a dierent supplier, it might compromise the
commitments we make to our customers, leading to us breaking
our contract, losing revenue or incurring nancial penalties.
• If our supply chain doesn’t meet legal, regulatory or ethical
standards it could damage our reputation and possibly lead to
legal action and nes.
• In December 2018 we announced that, in line with our long-
standing network architecture principles around the use of
Huawei, we will replace the current Huawei 4G core (inherited
through the EE acquisition). This will be implemented as we move
to a future new and combined 4G/5G core.
• For our most important suppliers, we keep a close watch
on our relationships, their performance and ability to meet
their obligations. We tell the business when there’s a risk of a
supplier failing, and our senior leaders review our readiness
for such events.
• We undertake due diligence when we introduce new suppliers
and in our continuing business with existing ones. That includes
checks on company nances, business systems, accreditations,
media reputation and ethical practices. The standards we apply
are available on selling2bt.com.
• We are also rening the way our three lines of defence come
together to manage and assure supplier risks.
• Our dealings with suppliers follow our trading, compliance
and ethical policies – see page 27 for more detail.
Developments in 2018/19
• With EU GDPR coming into force, we worked closely with our
suppliers through the year to help protect our people and
customers and incorporate privacy-by-design by default into the
products and services they supply us.
• We planned extensively for the potential impacts of Brexit on
our supply chain.
• We’ve been closely monitoring global political developments
with respect to Huawei.
• We started work to establish a new centralised third-party risk
and control capability.
• After the failure of Carillion (one of our large suppliers) last year,
we strengthened our risk monitoring processes, including the
ways we identify and respond to early warning signs of potential
supplier failure.
Link to strategy
1
3
Our principal risks and uncertainties continued
Link to business model
F
H
N
S
Trend

53
BT Group plc Annual Report 2019 Strategic report
Governance
Financial statements
Additional information
Colleague engagement
• There is a risk that our people are not suciently engaged to enable us to achieve
our strategic priorities
Potential impact Examples of how we mitigate
• Negative reactions to change might mean us losing talented
people, leading to us losing important skills and needing to hire
more external people, adding cost to the business.
• Poor engagement also raises the risk of general industrial unrest
and action.
• We’ve undertaken extensive consultations with unions, works
councils and colleague representatives to make sure we
maintain a healthy and positive relationship with our people.
• We’re continuing to streamline our management structure –
moving responsibilities closer to front line teams and speeding up
decision making to help deliver a better customer experience.
Developments in 2018/19
• We’ve worked constructively with our unions this year to agree
a number of transformation initiatives, including changes to
our dened benet pension scheme and the TUPE transfer
of our people into Openreach Limited.
• As we create a simpler business, we’re also working closely with
our unions to roll out a new people framework dening job
families and career levels for our people.
Change management
• Our BT transformation plan could fail to deliver its required benets
• There is also a risk that such deep and fast change can be distracting and cause
uncertainty amongst our people
Potential impact Examples of how we mitigate
• If we don’t manage our change programme carefully, we may not
deliver its intended benets, it could negatively impact customer
experience or aect our employee engagement.
• We could potentially overspend on the change programme itself.
Developments in 2018/19
• We made good progress delivering our BT transformation
plan, including establishing a new people framework for our
management grades.
• Work continued delivering a new Digital Global Services with an
agreed new organisational structure.
• We completed the integration of our Business and Public
Sector and Wholesale and Ventures units into a single new
Enterprise unit.
• We apply a formal structure and governance to our key
change programmes – for example our BT transformation plan
has a full-time programme oce and our
Executive Committee
reviews progress regularly. Change programmes are also
supported by our business transformation team.
• Close communication with our people and unions, supported
by monitoring our engagement levels, helps us manage the
uncertainty that the transformation may cause and to target
interventions where needed.
Trend
Link to strategy
1
3
Link to strategy
1
3
Trend
Link to business model
H
Link to business model
H
F

54
BT Group plc Annual Report 2019
Our viability statement
Assessment of prospects
An understanding of the group’s business
model and strategy is central to assessing its
prospects, and details can be found on pages
12 to 21.
Our business model provides resilience
that is relevant to any consideration of
our prospects and viability. In the UK, we
benet from diversication across a number
of markets and products, which increased
signicantly through the acquisition of EE.
We also have a broad spread of customers
and suppliers across dierent geographic
areas and market sectors, serving the needs
of customers in 180 countries worldwide.
Our strategy of delivering great customer
experience, investing in network leadership
and transforming our operating model
are all designed to support long-term and
sustainable cash ow growth.
We assess our prospects on a regular basis
through our nancial planning process.
Our Medium Term Plan forecasts the
group’s protability, cash ow and funding
requirements, and is reviewed by the Board
during the year. The Medium Term Plan is
built from the bottom-up forecasts of each
of our customer-facing units, supplemented
by items managed at a group level and
assumptions such as macro-economic
activity and exchange rates. The performance
of the group and our customer-facing units
against these forecasts is monitored monthly
and this is supplemented each quarter
through a series of Quarterly Business
Reviews of each unit conducted by the chief
executive ocer and chief nancial ocer.
Beyond our Medium Term Planning horizon,
the group also makes investments that
have business cases covering a longer time
period, such as our network investments.
Signicant capital expenditure investment
cases are approved by the chief executive
ocer and, where appropriate, the Board,
after taking into account longer-term risks
and opportunities such as the economy,
technology and regulation.
Our business and nancial planning also takes
into account our longer-term obligations,
including the funding of our dened benet
pension schemes.
Viability statement
In accordance with provision C.2.2 of the
2016 UK Corporate Governance Code, the
directors have assessed the prospects and
viability of the group.
Although the directors have no reason to
believe that the Group will not be viable
over a longer period, the Board has chosen
to conduct this review for a period of three
years to 31 March 2022. The Board believes
this is an appropriate timeframe as it aligns
with the primary focus of our business
planning and the underpinning time cycles of
a number of our principal risks: for example
the pension scheme funding valuation and
Ofcom’s market review cycles.
In support of this statement we’ve stress
tested our forecast cash ow by assessing,
through a probabilistic analysis, the range
of potential combined impacts our most
signicant risks could have on these
forecasts. This assessment was informed by
our judgements as to the potential nancial
impact of these risks if they materialise,
together with their likelihood of occurrence.
Our stress testing conrmed that existing
projected cash ows and cash management
activities provide us with a buer against
the impact of our most likely risks. In the
most extreme scenarios we tested, we have
considered the further actions we could
take to mitigate the negative cash ow
impact and ensure additional liquidity. These
actions could include, for example, sale of
assets, limiting or delaying discretionary
capital expenditure and marketing activities,
restricting share buy-back programmes and
reducing or ceasing dividend payments.
In our viability assessment we’ve adopted
a number of assumptions designed to
stress test our resilience. For example, in
making our assessments of the impact and
likelihood of our risks, we’ve only taken into
account the control activities that we have
in place today. We’ve not factored in any of
the extensive future mitigation activities
that we’re undertaking to address these
risks, thereby assuming such activity proves
ineective. Whilst we do not expect this to
happen, we’ve adopted these pessimistic
assumptions to add greater stress to our
viability testing.
We’ve also assumed that, should the need
arise, we would have both the ability to
renew existing debt facilities which mature
over the three-year period and be able to
raise new debt.
Based on the results of this analysis, the
directors have a reasonable expectation
that the group will be able to continue in
operation and meet its liabilities as they
fall due over the three-year period of their
assessment.

55
BT Group plc Annual Report 2019 Strategic report
Governance
Financial statements
Additional information
Contents
Governance
Chairman’s governance report 56
Our governance framework 57
Board of Directors 58
The Board 60
Relations with shareholders 64
Reports of the Board committees 66
• Nominations Committee chair’s report 66
• Audit & Risk Committee chair’s report 69
Report on directors’ remuneration 73
• Remuneration Committee chair’s letter 73
• Focus on remuneration 76
• Annual remuneration report 79
Directors’ information 92
General information 94
Financial statements 100
Additional information 185
Our corporate governance compliance statement
As a Premium Listed company BT is subject to the UK Corporate Governance Code (the Code)
published by the Financial Reporting Council. For 2018/19 we are reporting against the 2016
version of the Code and the Board considers that throughout the year BT has complied with the
provisions of the Code and applied the main principles of the Code as described on pages 55 to 99
of this report.
Directors’ report
The directors submit their report and the audited nancial statements of the company, BT Group plc,
and the group, which includes its subsidiary undertakings, for 2018/19. BT Group plc is the listed
holding company for the BT group of companies. Its shares are listed on the London Stock Exchange,
and on the New York Stock Exchange in the form of American Depositary Shares.
We believe that eective corporate governance is
critical to delivering our strategy and creating long-
term value for our shareholders. We also recognise
the importance of our wider stakeholders in delivering
our strategy and achieving sustainability within our
business. We are always conscious of our responsibilities
and duties to these stakeholders under section 172
of the Companies Act 2006. We have detailed our
stakeholders and their importance to our business
in the Strategic report on pages 1 to 54.
The Code and associated guidance are available onthe
Financial Reporting Council website at frc.org.uk
Leadership
The Board is collectively
responsible for the long-term
success of the company. Read
more about how our board leads
BT on pages 60 to 63.
Accountability
The Board has established the
Audit & Risk Committee
to
oversee corporate reporting,
risk management and internal
control and our relationship with
the company’s external auditors.
Read more about this in the
Audit
& Risk Committee
chair’s report
on pages 69 to 72.
Eectiveness
We continually think about
the eectiveness of our board
and its committees including
composition, induction and
development of directors. Read
more about eectiveness on
pages 55 to 75.
Remuneration
The Board has established the
Remuneration Committee
to
develop the remuneration
policy and set the remuneration
for the executive directors
and other senior executives.
Read the Report on directors’
remuneration on pages 73 to 90.

56
BT Group plc Annual Report 2019
On behalf of the Board, I am pleased to
present the governance report for the year
ended 31 March 2019. We continue to
believe that eective corporate governance
is critical to delivering our strategy
and creating long-term value for our
shareholders.
Corporate Governance Code
During the year, BT has complied with the
provisions of the UK Corporate Governance
Code 2016 and applied its principles. Also,
in preparation for our adoption of the UK
Corporate Governance Code 2018 from
1 April 2019, we have carried out a detailed
review of our governance framework.
We will report on our application of the
UK Corporate Governance Code 2018
in our 2020 Annual Report, including
the mechanism we’ll have put in place to
ensure eective engagement by the Board
with our colleagues.
Board changes and activities
In June 2018, we announced that Gavin
Patterson would stand down as chief
executive. After an extensive external
search, Philip Jansen was appointed as
an executive director on 1 January 2019
and became chief executive on 1 February
2019 following a handover period with
Gavin.
During the year, we have continued to keep
under review the composition of the Board
and its committees to ensure that we have
the right balance of skills, independence,
experience and diversity. We have
welcomed Matthew Key and Allison Kirkby
to the Board as non-executive directors
who bring a wealth of knowledge and
experience in the telecoms sector. We have
reviewed the independence of Nick Rose
and Jasmine Whitbread, both of whom
have served more than eight years, and
concluded that they continue to remain
independent in character and judgement. It
is the current expectation of the Board that
Nick and Jasmine will step down by the end
of the 2020 AGM. Nick and Jasmine bring
considerable experience to the Board and
by remaining in post for a further year they
will provide invaluable continuity during
Philip’s rst year as chief executive.
Streamlining governance
In line with the rest of the business, we
have sought to streamline our governance
processes and structures. To this end
we have reviewed our governance
framework and reduced the number of
board committees, clarifying the lines of
responsibility. We have also reviewed and
refreshed the terms of reference of all
board committees ensuring consistency
and clarity. Details of the refreshed board
committee structure and the duties
of these committees are described on
page57.
Engaging with our stakeholders
We recognise the importance of our wider
stakeholders in delivering our strategy
and business sustainability. We are
conscientious about our responsibilities and
duties to our stakeholders under section
172 of the Companies Act 2006. We have
detailed our stakeholders, their importance
to our business and our engagement with
them in the Strategic report on pages 1
to54.
I would like to thank the Board and
executive team for their ongoing support.
I look forward to continuing to work
together as we implement our streamlined
governance processes and structures.
Jan du Plessis
Chairman
8 May 2019
We believe that eective
corporate governance is
critical to delivering our
strategy and creating
long-term value for our
shareholders.
Chairman’s governance report
You can nd the refreshed board
committee structure and terms of
reference on our website at btplc.com

57
BT Group plc Annual Report 2019 Strategic report
Governance
Financial statements
Additional information
The Board
The Board is responsible for managing the group, agreeing strategy, setting the budget, overseeing
performance and discharging certain legal responsibilities. The Board has established certain committees to
assist it in discharging its responsibilities and delegates day-to-day responsibility for running the group to
thechiefexecutive.
Our governance framework
Audit & Risk
Committee
The
Audit & Risk Committee
oversees, assesses and reviews
BT’s nancial and narrative
reporting, internal controls and
risk management, including
internal and external audit, core
compliance programmes and
non-nancial assurance.
Digital Impact &
Sustainability Committee
The
Digital Impact & Sustainability
Committee
provides oversight and
direction to bring BT’s purpose to
life through the digital impact and
sustainability strategy.
Remuneration
Committee
The
Remuneration Committee
agrees the remuneration
framework for the chairman,
executive directors and certain
senior executives.
Investigatory
Powers Governance
Committee
The
Investigatory Powers
Governance Committee
oversees
BT’s role in the use of ocial
investigatory powers.
Nominations
Committee
The
Nominations Committee
makes sure the Board has the
appropriate balance of skills,
experience, independence,
knowledge and diversity. It
also provides input on the chief
executive’s plans for executive
succession.
Pages 58 and 59 Board biographies
Pages 60 and 61 Board activities for the year
Pages 62 and 67 Board diversity
btplc.com
Chief Executive
Our chief executive is responsible for running the business
and delivering our strategy.
BT Compliance
Committee
The
BT Compliance
Committee
is a sub-
committee of the
Audit &
Risk Committee
. It oversees
BT’s adherence to the
Commitments made as
part of the 2017 Digital
Communications Review
with Ofcom.
Executive Committee
The
Executive Committee
provides input
and recommendations to help
the chief executive run the business.
BT Investment Board
The
BT Investment Board
provides input and recommendations that
support the chief executive’s decision making
on investment budgets and cases.
The
BT Pensions
and
Technology Committees
were disbanded on 3 April 2019.

5958
BT Group plc BT Group plcAnnual Report 2019 Annual Report 2019 Strategic report
Governance
Financial statements
Additional information
Iain Conn
Independent non-executive director
Appointed to the Board in June 2014. Age 56.
Skills and experience
Iain has international experience and an
understanding of technology, energy and
regulated consumer markets. Iain joined Centrica
as chief executive in January 2015, having been
with BP since 1986. From 2004 to 2014 Iain
was executive director of BP and chief executive
downstream from 2007 to 2014. Until May
2014, Iain was a non-executive director of Rolls-
Royce for nine years and senior independent
director.
Other appointments include
Member of the CBI President’s Committee,
chairman of the advisory board of the Imperial
College Business School and member of the
Imperial College Council.
Tim Höttges
Non-independent, non-executive director
Appointed to the Board in January 2016.
Age 56.
Skills and experience
Tim has international telecoms experience
having been CEO of Deutsche Telekom since
January 2014, and with the company since
2000. From 2009 until his appointment as CEO,
he was a member of the board of management
responsible for nance and controlling. From
2006 to 2009 he was a member of the board of
management responsible for the T-Home unit. In
this position, he was in charge of xed network
and broadband business, as well as integrated
sales and service in Germany.
Other appointments include
Chairman of T-Mobile US and supervisory board
member of FC Bayern München AG and Henkel
AG & Co. KGaA.
Key to membership of committees
Isabel Hudson
Independent non-executive director
Appointed to the Board in November 2014.
Age 59.
Skills and experience
Isabel has experience in the nancial sector as
well as pensions, risk, control, governance and
international business. Isabel was previously
a non-executive director of The Pensions
Regulator, MGM Advantage, QBE Insurance,
Standard Life and an executive director of
Prudential Assurance Company in the UK.
Other appointments include
Non-executive chair of National House Building
Council and senior independent director of RSA
Insurance. Isabel is also an ambassador for the
disability charity, SCOPE.
A
Audit & Risk
C
BT Compliance
D
Digital Impact & Sustainability
E
Executive
IP
Investigatory Powers Governance
N
Nominati ons
R
Remuneration
E
Committee chair
A
N
N
Nick Rose
Senior independent director and
independent non-executive director
Appointed to the Board in January 2011 and
senior independent director since March 2014.
Age 61.
Skills and experience
Nick brings experience in nance, risk, control,
governance and international business . He
was chief nancial o cer of Diageo prior to his
retirement in December 2010, having joined the
board in 1999.
Other appointments include
Chairman of Williams Grand Prix Holdings,
senior independent director of BAE Systems and
non-executive chairman of Loch Lomond Scotch
Whisky.
Jasmine Whitbread
Independent non-executive director
Appointed to the Board in January 2011.
Age 55.
Skills and experience
Jasmine has experience in transforming
large complex organisations in the UK and
internationally and brings an understanding of
corporate social responsibility and sustainable
business. She was previously chief executive
of Save the Children International and has a
background in technology marketing.
Other appointments include
Chief executive of London First and non-
executive director of Standard Chartered.
Rachel Canham
Company secretary & general
counsel, governance
Rachel joined BT in 2011 and was
appointed company secretary &
general counsel, governance in
November 2018.
A
R
N
D
A
C
N
C
D
N
R
Jan du Plessis
Chairman
Appointed chairman in November 2017 and on
the Board since June 2017. Age 65.
Skills and experience
Jan has signi cant experience on the boards of
major UK public companies, having served as
chairman and non-executive director of various
FTSE100 companies across a range of sectors.
Jan was chairman of Rio Tinto from 2009 to
March 2018 and chairman of SABMiller from
July 2015 until October 2016 having been with
the company since 2014. He was also a director
and senior independent director of Marks &
Spencer from 2008 and 2012 respectively until
March 2015.
Other appointments
None outside BT.
Simon Lowth
Chief nancial o cer
Appointed to the Board as chief nancial o cer
in July 2016. Age 57.
Skills and experience
Simon has experience in nance, accounting,
risk, corporate strategy and mergers and
acquisitions. He was CFO and executive director
of BG Group before the takeover by Royal Dutch
Shell in February 2016. Simon was CFO and an
executive director of AstraZeneca from 2007
to 2013. Prior to that, he was an executive
director of ScottishPower from 2003 to 2007
and was appointed nance director in 2005.
Before 2003, Simon was a director of McKinsey
& Company.
O ther appointments
None outside BT.
Board of Directors
Matthew Key
Independent non-executive director
Appointed to the Board in October 2018.
Age 56.
Skills and experience
Matthew’s telecoms experience includes various
positions at Tele f ónica from 2007 to 2014
including chairman and CEO of Tele fónica Europe
and chairman and CEO of Tele f ónica Digital. From
2002 to 2004 he was the CFO, strategy and
regulation director of O2 UK before becoming
CEO in 2004. Matthew has also served as nance
director at Vodafone UK and chairman of Tesco
Mobile. He has previously held positions at
companies including King sher , Coca Cola and
Schweppes Beverages and Grand Metropolitan.
Other appointments include
Non-executive director of Burberry and
chairman of the Dallaglio Foundation .
Allison Kirkby
Independent non-executive director
Appointed to the Board in March 2019. Age 51.
Skills and experience
A llison has valuable experience in the
international telecoms sector and in driving
performance, improving customer service
and delivering shareholder value. Allison was
previously group CFO and then president and
group CEO of Tele2 AB, positions she held from
2014 and 2015 respectively. Allison was a non-
executive director of Greggs until May 2019
and has also held roles within 21st Century Fox,
Virgin Media, Proct er & Gamble and Guinness.
O ther appointments include
President and Group CEO of TDC Group.
Mike Inglis
Independent non-executive director
Appointed to the Board in September 2015.
Age 59.
Skills and experience
Mike’s technology experience includes serving
as non-executive chairman of Ilika until January
2019 and on the board of ARM Holdings from
2002 to 2013. His roles there included chief
commercial o cer, executive vice president
and general manager of the processor division
and executive vice president of sales and
marketing. Prior to joining ARM, Mike worked
in management consultancy with AT Kearney
and held a number of senior operational and
marketing positions at Motorola. Mike was
previously a director of Pace and an independent
director of Advanced Micro Devices.
Other appointments
None outside BT.
IP
N
D
C
D
N
R
E
A
N
A
N
E
Philip Jansen
Chief executive
Appointed chief executive in February 2019 and
on the Board since January 2019. Age 52.
Skills and experience
Philip has experience of leading and
growing large private and publicly-listed
UK and international businesses, delivering
transformational change and large technology
programmes. He joined from Worldpay where
he had been CEO since April 2013. Before
that he was CEO and then chairman at Brakes
Group between 2010 and 2015. Philip spent
the previous six years at Sodexo where he was
group chief operating o cer and chief executive,
Europe, South Africa and India. Prior to that he
was chief operating o cer at MyTravel Group
from 2002 to 2004 and managing director of
Telewest Communications (now Virgin Media)
from 2000 to 2002 after starting his career at
Procter & Gamble.
Other appointments include
Senior adviser at Bain Capital and a trustee of
Wellbeing of Women.
Board of Directors

60
BT Group plc Annual Report 2019
The Board
Leadership
Board activities
The Board is responsible for managing the group, agreeing strategy, setting the budget, overseeing performance and discharging certain
legal responsibilities. It passes day-to-day management to the chief executive, but certain matters are reserved to the Board, including the
approval of major acquisitions and other strategically important issues. The Board sets the strategic direction for the company, shapes the
organisational culture, promotes corporate governance and plays a key role in creating sustainable growth in shareholder value.
The table below describes the Board’s activities throughout the year. It is not an exhaustive list; instead it provides a high-level overview
of discussions held during board meetings and the wide range of factors that the directors consider in order to help the company achieve
its goals.
Agenda item Discussions, decisions and actions
Strategy and transformation
Strategic priorities At the start of the year, the Board discussed the key themes and actions arising from the 2017/18
strategy day. They agreed a programme of strategic discussions to be covered at meetings throughout
2018/19. The Board revisited strategic priorities throughout the year, as detailed below.
Spectrum strategy The Board approved BT’s bidding strategy and nancial envelope for Ofcom’s 3.4GHz spectrum auction.
BT secured 40MHz of 3.4GHz spectrum suitable for 5G services, strengthening EE’s mobile network
leadership.
Network strategy The Board discussed the development of BT’s integrated, long-term network strategy, including
investment in ultrafast xed network technologies and plans to lead the market to 5G.
Performance and risk
Financial performance BT’s nancial performance and outlook was considered at each meeting throughout the year and the
Board approved the Medium Term Plan for the group.
At each quarter-end the Board approved the nancial statements and results announcements and at
year-end they approve the Annual Report and Form 20-F.
Enterprise risk management The Board conducted their annual review of the Group Risk Register. They discussed the principal risks
and uncertainties facing the group, which are set out on pages 46 to 53 of the Strategic report. Each
risk owner will report to the Board on their area of risk during 2019/20.
Board risk oversight The Board reviewed their oversight of BT’s risk management and internal control systems, and their
assessment of principal risks. The Board concluded that these risks were appropriately monitored by the
Board and its committees.
Organisation, people and culture
Health, safety
and wellbeing
The Board received reports on the health, safety and wellbeing of our people. They discussed how we
support our people during times of change and transformation and the importance of promoting a
strong culture of safety across BT.
Better workplace BT’s workplace transformation for UK desk-based employees will focus on around 30 modern, strategic
sites to create a more collaborative, open and customer focused working culture. The Board received
updates on this initiative throughout the year.
People framework The Board discussed the programme to transform BT’s operating model and build a lean, agile
organisation that delivers sustained improvement in customer experience and productivity.
Talent and culture The Board reviewed succession plans for members of the
Executive Committee,
discussed talent and
diversity initiatives and discussed BT’s organisational culture and aspirations.
Chief executive succession The Board agreed that Gavin Patterson should step down as chief executive, and approved the
appointment of Philip Jansen as his successor. Philip joined the Board as an executive director on
1January 2019 and, following a handover period with Gavin Patterson, became chief executive on
1February 2019.

61
BT Group plc Annual Report 2019 Strategic report
Governance
Financial statements
Additional information
Stakeholders
Customer experience The Board considered and endorsed our customer experience ambition, performance and plans
for the business.
Investor relations The Board received reports on market perspectives from investor relations and the external brokers.
Political and regulatory
engagement
The Board endorsed the political and regulatory strategy for the group.
Governance and compliance
Secretary’s report The company secretary reported on key governance developments and recommendations at each board
meeting, including proposed changes to board committee membership and terms of reference.
Committee reports Committee chairs reported back to the Board on matters discussed at committee meetings.
Corporate governance The Board received briengs on developments in corporate governance, including the new Corporate
Governance Code 2018, and refresher training on the Market Abuse Regulation and BT’s disclosure
obligations.
Board evaluation More details can be found on page 63
. The chairman conducted individual evaluations of each director
to make sure they continued to contribute eectively and demonstrated commitment to the role. The
senior independent director led the chairman’s performance evaluation, taking into account the views
ofother directors.
Time commitment
All directors are expected to attend all meetings of the Board and any committees of which they are members, as well as the AGM and any
board away days. Directors are also expected to devote sucient time to prepare for each board and/or committee meeting and to take part
in at least one visit to one of BT’s oces or other sites each year. By accepting their appointment each non-executive director has conrmed
that they are able to allocate sucient time to the company to discharge their responsibilities eectively. Non-executive directors are also
required to obtain the agreement of the chairman before accepting any additional commitments that might aect the time they are able
to devote to their role as non-executive director of BT. In accordance with the new Corporate Governance Code 2018 for the nancial year
2019/20 onwards, directors must seek prior approval of the Board before accepting additional external appointments.
Attendance at meetings
The table below summarises members’ attendance at board meetings in 2018/19. If directors are unable to attend a meeting, they are
encouraged to oer their views and comments on the topics and board papers to the chairman in advance of the meeting.
Board members and attendance
Member
Eligible
to attend Attended
Jan du Plessis (chairman) 10 10
Philip Jansen
a
2 2
Gavin Patterson
b
9 9
Simon Lowth 10 10
Tony Ball
c
4 3
Iain Conn 10 10
Tim Höttges 10 9
Isabel Hudson 10 10
Mike Inglis 10 10
Matthew Key
d
4 4
Allison Kirkby
e
0 0
Karen Richardson
c
4 3
Nick Rose 10 10
Jasmine Whitbread 10 10
a
Philip was appointed to the Board as an executive director on 1 January 2019 and became chief executive on 1 February 2019.
b
Gavin stepped down from the Board at midnight on 31 January 2019.
c
Tony and Karen retired from the Board on 11 July 2018.
d
Matthew was appointed to the Board on 25 October 2018.
e
Allison was appointed to the Board on 15 March 2019.

62
BT Group plc Annual Report 2019
The Board continued
Leadership continued
Director induction
On appointment, directors are provided with an induction programme to ensure they gain a thorough overview of the business. This
includes meetings with the chairman, chief executive, senior independent director and company secretary, as well as other board and
Executive Committee
members and senior members of management. We encourage directors to visit BT sites, for example Adastral Park,
the BT Sport studio, contact centres and EE shops. Directors can also spend a day with an Openreach engineer.
The programme provides new directors with details of the role and responsibilities of the Board and BT’s governance framework.
New directors also receive key information such as recent nancial data and the policies supporting our business practices, including
our ethics code.
Division of responsibilities
The division of responsibilities between the chairman and the chief executive are clearly documented in written job descriptions, and are
summarised below:
The chairman
• leads the Board and creates a culture of openness characterised by
robust, respectful debate and appropriate challenge
• promotes the highest standards of corporate governance
• ensures the Board understands the nature and extent of any signicant
risks BT is willing to take to implement its strategy
• makes sure the Board receives accurate, timely and clear information
and is consulted on all relevant matters
• monitors the contribution and performance of board members
• makes sure BT communicates clearly with shareholders and discusses
their views and concerns with the Board
• acts as a key contact for important stakeholders, as well as working with
the chief executive and the senior independent director to represent BT
in key strategic and government relationships.
The independent non-executive directors
• bring experience and independent judgement to the Board
• develop and constructively challenge strategy proposals.
Each non-executive director is appointed for an initial three-year term
but is subject to annual re-election by shareholders at the Annual General
Meeting.
The non-independent, non-executive director
After acquiring EE, Deutsche Telekom’s nominated director Tim Höttges
was appointed to the Board. As a non-independent, non-executive
director, Tim has the same responsibilities as the other directors. Tim owes
a duciary duty to both BT and Deutsche Telekom. We set up the
Conicted
Matters
Committee
to identify potential or actual conicts of interest.
The chief executive
• leads the group’s performance and management
• proposes strategies, business plans and policies to the Board
• implements board decisions, policies and strategies
• develops and promotes compliance with BT’s policies on conducting
business around the world
• maintains an eective framework of internal control and risk
management
• leads the
Executive Committee
in the day-to-day running of every part
of the business
• leads, motivates and monitors the performance of BT’s senior
management team, as well as overseeing succession planning for roles
on the
Executive Committee
.
The senior independent director
• meets with BT’s major institutional shareholders and shareholder
representative bodies to discuss matters that would not be appropriate
for discussion with the chairman or the chief executive
• acts as a sounding board for the chairman and as an intermediary
between the chairman and other directors
• reviews the chairman’s performance during the year, taking account
of feedback from other board members.
Independence of directors
The majority of the Board are independent non-executive
directors. BT judged the chairman to be independent at the time
of his appointment, and considers all other non-executive directors
to be independent under the terms of the Code with the exception
of Tim Höttges, Deutsche Telekom’s nominated director who
owes a duciary duty to both BT and Deutsche Telekom. Our
Conicted Matters Committee
identies potential or actual
conicts of interest for Tim.
Chairman
1
Executive directors
2
Independent
non-executive directors
7
Non-independent,
non-executive director
1
Balance of board membership
Male 73%
Female 27%

63
BT Group plc Annual Report 2019 Strategic report
Governance
Financial statements
Additional information
Outcome
The most signicant risks
facing BT are allocated
to the Board or one of its
committees. The governance
framework was reviewed and
we reduced the number of
board committees, clarifying
the lines of responsibility. We
also reviewed and refreshed
the terms of reference of
each of the committees.
Outcome
The length of board
meetings has been extended
and more time has been
allocated to strategic
matters. The annual board
programme is under review
to ensure that the Board has
sucient time for discussion
of these issues.
Outcome
The
Nominations Committee
is now the forum which
considers executive
succession planning. During
the year the committee has
spent a considerable amount
of time in connection with
the appointment of the chief
executive.
Outcome
The Board has spent time
during the year on talent and
culture and will continue to
do so in the year ahead.
Board evaluation
In 2017 the Board engaged an external facilitator to carry out a review of the Board and its committees. The main actions and outcomes
from the 2017/18 external evaluation are set out below:
Training and information
We encourage all directors to keep their skills and knowledge up to
date, and we give the Board and individual directors any training
they may need. Agendas and accompanying papers are distributed
to the Board and committee members in advance of each board
or committee meeting. These include reports from members of
senior management and external advisers. During board meetings
the chief executive provides regular updates. These are designed to
give directors a good understanding of operational issues and the
competitive and regulatory environment that aects BT and the
wider communications industry, as well as group and business unit
performance, investor relations matters and corporate responsibility.
The company secretary provides briengs on any signicant legal
and governance developments. During the year these briengs have
included updates on the new UK Corporate Governance Code 2018
and refresher training on the Market Abuse Regulation.
The information supplied to the Board and its committees is kept
under review and formally assessed on an annual basis as part of
the Board evaluation exercise. This ensures it is t for purpose and
supports the directors in eectively discharging their duties under
the Companies Act, the Listing Rules, the Disclosure Guidance &
Transparency Rules and the Code.
The chairman works with individual directors to identify any
specic training they need to successfully full their role. Non-
executive directors regularly meet with management, enhancing
their understanding of the business through brieng sessions. The
chairman typically holds private sessions with our independent non-
executive directors before board meetings and holds dinners before
most board meetings for all board members. We hold a dinner at least
once a year for members of the Board and the
Executive Committee
.
Election and re-election of directors
Matthew Key, Philip Jansen and Allison Kirkby (appointed to the
Board on 25 October 2018, 1 January 2019 and 15 March 2019
respectively) will be proposed for election by shareholders at the
2019 AGM. All other directors will be proposed for annual re-election
in line with the Code.
The Board believes that each director brings considerable knowledge
and wide ranging skills and experience to the Board as a whole and
continues to make an eective and valuable contribution to the
deliberations of the Board. Each director has continued to perform
eectively and demonstrate commitment to their role.
We include details of all directors’ contracts/letters of appointment in
the Report on directors’ remuneration on page 90.
Action Action Action Action
Further clarifying the
allocation of risk oversight
responsibilities across the
Board and its committees
to ensure the directors
eectively discharge their
duties.
Prioritising discussions
to spend more time on the
most important issues facing
the company and spending
more time with
management on strategic
issues.
Increasing attention
on succession planning
for senior management
including the
Executive
Committee
.
Devoting more time to
monitoring the evolution
of culture.
Key areas of focus Suggested actions
Strategy setting and
strategic priorities
• Further time during meetings for discussion of strategic priorities, in particular, network strategy
• Management to include external perspectives, benchmarking and insight into competitors in
proposals, where possible and appropriate.
Cultural transformation • The Board should receive regular updates to track progress of our cultural transformation
• Board visits to include engagement with colleagues at all levels within the organisation.
Talent management
and succession planning
for executives
• Greater focus on senior executive succession planning at the
Nominations Committee
• Regular reporting on how senior executives are performing and their development needs
• More visibility of key talent at board meetings and visits.
During 2018/19 we carried out an internal evaluation of the Board and its committees led by the chairman and the company secretary.
Members, attendees and external advisers completed questionnaires, the output of which was discussed and debated by the Board and
the respective committees. The output was positive overall. In particular the relationship between board members is positive and board
discussions are viewed as open, rigorous and constructive. Our key areas of focus for 2019/20 are set out below:

64
BT Group plc Annual Report 2019
Relations with shareholders
Individual shareholders
We have over 829,000 individual shareholders. As well as using
our website, they receive regular communications and are all
invited to attend our AGM. The company secretary oversees
communications with individual shareholders, making sure we
respond as appropriate to any matters regarding their shareholding.
A dedicated team at Equiniti (our share registrar) also looks after
their needs. We encourage direct payment of dividends and
e-communications; this improves the security and eciency of
our communications and reduces the amount of paper we use.
Institutional shareholders
Our executive management team regularly meets with institutional
investors. The chairman, senior independent director and other
board members also meet with investors where appropriate. We do
this via an investor relations programme that includes one-to-one
meetings, roadshows, group meetings, conferences and industry
events. During 2018/19 we held around 500 meetings with
investors, covering a wide range of topics including our strategy,
nancial and operational performance, capital investment,
pension, remuneration, capital allocation policy and relations with
government and our regulator. We gather feedback from our main
shareholders, which is regularly considered by management and
the Board.
In addition to the institutional shareholder programme, the following table describes some of the other ways we engage
with our shareholders:
AGM
The AGM provides an opportunity for directors to engage with shareholders, answer their
questions and meet them informally. The 2019 AGM will take place on Wednesday 10 July
in London. We invite all shareholders to attend and use the opportunity to ask questions. We
encourage those who cannot attend to vote by proxy on all the resolutions put forward. All
votes (with the exception of procedural resolutions) are taken on a poll. In 2018, voting levels
at the AGM were over 70% of the company’s issued share capital, the same level as in 2017.
Whilst the overall voting outcome was over 90% in favour of most resolutions at last
year’s AGM, the 2018 Annual Remuneration Report received an overall voting outcome
of 65.84% in favour. When we announced the results of this vote, we explained what
actions we intended to take to consult with shareholders on this result and we provided a
follow up announcement on 18 December 2018. Further details of our consultations with
shareholders are contained in the
Remuneration Committee
chair’s letter on pages 73 to 75.
Annual Report
We publish a full annual report and accounts each year that contains a strategic report,
governance section, nancial statements and additional information. The report is available
online and in paper format.
Press releases
We issue press releases for all substantive news relating to BT’s nancial and operational
performance. You can nd press releases on our website.
Results announcements
We release a full set of nancial and operational results at the interim and full year stage. We
release trading statements at the rst and third quarter with reduced disclosure, while still
providing sucient information to allow investors to model and value our business. The full
year results are accompanied by a presentation hosted by senior management, and the rst,
second and third quarter results are webcast. All our results events provide an opportunity for
investors to ask questions of management.
Website
Our website contains a comprehensive range of information on our company. There is
a section dedicated to investors, which includes our investor calendar, nancial results,
presentations, press releases and contact details. The area dedicated to individual
shareholders is an essential communications channel that includes information on
administration services, contact information and information for our shareholders.
btplc.com

65
BT Group plc Annual Report 2019 Strategic report
Governance
Financial statements
Additional information
Substantial shareholdings
At 8 May 2019, BT had received notice, under the Financial
Conduct Authority’s Disclosure Guidance & Transparency Rules,
inrespect of the following holdings of shares:
Date of notication Shares
% of total
voting rights
BlackRock Inc 28 November 2018 497,990,721 5.01%
At 31 March 2019, BlackRock’s interest was 569,835,476 shares
representing 5.74% of total voting rights. No requirement to
notify the company of any increase or decrease would have arisen
unless the holding moved up or down a whole number percentage
level. The percentage level may decrease on the transfer of
treasury shares for any of the company’s share plans.
In addition, T-Mobile Holdings Limited holds 1,196,175,322
shares representing 12% of total voting rights.
Annual General Meeting
Resolutions
As part of our policy to involve shareholders fully in the aairs
of the company, our AGM gives them the opportunity to ask
questions about BT’s activities. We also give shareholders the
opportunity to vote on every important issue by proposing a
separate resolution for each.
Before the AGM, we count the proxy votes for and against
each resolution, as well as votes withheld, and make the results
available at the meeting. As at previous AGMs, we will take votes
on all matters at the 2019 AGM on a poll, except procedural
issues.
The separate Notice of meeting 2019, which we send to all
shareholders who have requested shareholder documents by
post, contains the 21 resolutions (with explanatory notes) we
will propose at the 2019 AGM on 10 July in London. We notify
all shareholders of the publication of these documents, which we
send out in the most cost-eective way. We aim to give as much
notice of our AGM as possible and at least 21 clear days’ notice, as
required by our Articles of Association. In practice, we send these
documents to shareholders more than 20 working days before
the AGM. (For other general meetings this should be at least 14
working days in advance.)
At the AGM we will propose resolutions to re-appoint KPMG as
BT’s auditors and to authorise the
Audit & Risk Committee
to
agree their remuneration. We will also ask our shareholders to
vote on both the Annual Report and the Report on directors’
remuneration.
Authority to purchase shares
The authority given at last year’s AGM for BT to purchase in the
market 992million of its shares, representing 10% of the issued
share capital, expires on 10 July 2019. We will ask shareholders
to give a similar authority at the 2019 AGM.
During 2018/19, no shares were purchased under this authority.
During 2018/19, we transferred 916,407 treasury shares to
meet BT’s obligations under our employee share plans. At 8May
2019, we held a total of 45.2million shares as treasury shares.
The BT Group Employee Share Ownership Trust (the Trust)
purchased 4.3million BT shares for a total consideration of
£9.5m. The Trust continued to hold 9million shares at
8May 2019.

66
BT Group plc Annual Report 2019
Nominations Committee
Chair’s report
Activities in 2018/19
Succession has been the key area of focus this year. The committee
oversaw the appointments of the new chief executive (following the
announcement in June 2018 that Gavin Patterson would step down),
and two new non-executive directors.
For the chief executive position, the committee agreed a role
specication and undertook a detailed review of candidates
suggested by both committee members and MWM Consulting (an
external search organisation with no connection to BT), leading to a
shortlist of potential candidates. Following a comprehensive review
process, the committee made a clear recommendation to the Board,
culminating in the appointment of Philip Jansen as chief executive.
Philip is a proven leader with outstanding experience in managing
large, complex businesses.
The committee also reviewed the company’s need for non-executive
directors throughout the year. As with the chief executive succession
process described above, MWM Consulting was engaged to identify
potential new non-executive directors. Following a review of its
long list of possible candidates, a shortlist of particularly promising
individuals were invited to meet members of the committee and the
chief executive. Following this process, the committee recommended
to the Board the appointment of Matthew Key and Allison Kirkby as
non-executive directors.
Matthew has hugely valuable and relevant experience from his time
at O2 UK, Telefónica and Vodafone UK. As well as strategic skills and
experience as a non-executive, Allison brings valuable and recent
experience in the international telecoms sector and has experience
in driving performance, improving customer service and delivering
shareholder value. Both are excellent additions to the Board.
As well as the new appointments to the Board, the committee also
recommended that Mike Inglis’s appointment as an independent
non-executive director be extended for a further three-year
term from 1September 2018. Mike has a wealth of technology
experience and makes a valuable and broad-ranging contribution
to the Board and the committees of which he is a member.
Membership and key responsibilities
The committee comprises all of the company’s non-executive
directors. The company secretary attends the meetings, as
does the chief executive where appropriate.
We are responsible, on behalf of the Board, for keeping under
review the balance of executive and non-executive directors,
together with the composition of the Board and board
committees in terms of members’ skills, experience, diversity,
independence and knowledge.
We receive reports from the chief executive on
Executive
Committee
succession planning. We also consider and agree
appointments to and removals from the
Executive Committee
.
Attendance
Member
Eligible
to attend Attended
Jan du Plessis (chair) 6 6
Tony Ball
a
2 1
Iain Conn 6 6
Tim Höttges
b
5 5
Isabel Hudson 6 6
Mike Inglis
c
6 6
Matthew Key
d
2 2
Allison Kirkby
e
0 0
Nick Rose 6 6
Jasmine Whitbread
c
6 5
a
Tony stepped down from the committee on 11 July 2018.
b
Tim was appointed to the committee on 1 May 2018.
c
Mike and Jasmine were appointed to the committee on 1 April 2018.
d
Matthew was appointed to the committee on 25 October 2018.
e
Allison was appointed to the committee on 15 March 2019.
66
BT Group plc Annual Report 2019

67
BT Group plc Annual Report 2019 Strategic report
Governance
Financial statements
Additional information
The committee discussed whether or not Nick and Jasmine remain
independent after eight years on the Board and considered that they
do, taking into account:
• their personal qualities and circumstances, including that there are
no relevant relationships or circumstances to suggest that they do
not remain independent and they have other directorships outside
of BT, further evidencing that they remain independent
• the context of the proposed re-appointments, namely the ongoing
refresh of the Board with two new non-executive directors
appointed within the last 12 months and a new chief executive
appointed in February 2019.
Both recommendations to the Board followed a rigorous review of
Nick and Jasmine’s performance, and we continue to believe that
they make a valuable and broad ranging contribution to both the
Board and the committees of which they are members. This will
also bring invaluable continuity during Philip’s rst year as chief
executive. We also reviewed their other roles to assess if they have
sucient time available to discharge their board responsibilities
eectively. Our ndings lead us to believe these other roles do not
prevent them from making a full contribution as BT non-executive
directors.
It is the current expectation of the Board that Nick and Jasmine
will step down by the end of the 2020 AGM.
During the year we also conducted a review of members of the
Executive Committee
. 2018/19 has been a year of signicant
change in the business as we continued to transform BT while
transitioning to a new chief executive. We consider that the
Executive Committee
has performed well over the year.
Board diversity
We consider the diversity of board and board committee members
carefully to ensure we benet from the right balance of skills,
range of experience, knowledge and diversity (including gender).
We currently have three female board members out of eleven,
equivalent to 27% female representation.
We continue to work towards achieving the Hampton-Alexander
review target of at least 33% female board representation by 2020,
and the Parker review target of at least one director of colour by
2021. We challenge our external search consultants where necessary
to ensure that diversity is always considered when drawing up
candidate shortlists. However, while taking these important
considerations into account, we will continue to recommend
appointments to the Board based on merit and the individual
skills and experience of each candidate.
Governance structure and eectiveness
The committee reviewed the composition, remit and terms of
reference of each board committee, and recommended to the
Board simplication of the governance framework.
The composition of the committees has been refreshed to take
into account the new board members and the skills that they bring
to the Board. The streamlining of the governance framework has
reduced the number of board committees, simplifying the lines of
responsibility and the operation of this framework. The
BT Pensions
Committee
has been disbanded and overall responsibility for
pensions continues to rest with the Board. Day-to-day authority
and accountability for pensions is delegated via the chief executive
to the chief nancial ocer. The
Technology Committee
has also
been disbanded, with the duties of this committee being covered
by the Board and management.
As part of the simplication of our committee structure, the
Nominating & Governance Committee
has been renamed the
Nominations Committee
, retaining all existing duties with regards
to nominating and succession for non-executive directors,
executive directors and members of the
Executive Committee.
Responsibility for governance continues to rest with the Board.
The committee has also considered recent corporate governance
developments and their implications for BT. The new UK Corporate
Governance Code 2018 and the Companies (Miscellaneous
Reporting) Regulations 2018 apply to BT for the nancial year
2019/20. An implementation plan is in place for these new
requirements and we will report on this in our 2020 Annual Report.

68
BT Group plc Annual Report 2019
The chief executive appointment process
Process Search Interviews
Candidate requirements
New chief executive announced
The committee agreed a detailed candidate prole setting out the capabilities and experience required.
Following initial interviews with the chairman
and a further review with committee
members, the number of candidates was
reduced. The remaining committee members
met with the shortlisted candidates.
Following their interviews, each committee member provided feedback on the candidates to the chairman.
The committee discussed the relative merits of each candidate and agreed that Philip Jansen should be proposed
to the Board for appointment as chief executive. The Board approved his appointment as an executive director
from 1 January 2019 and as chief executive from 1 February 2019.
The process to appoint the new chief
executive was led by the chairman, with MWM
Consulting appointed to facilitate the process.
The committee as a whole was closely involved
in identifying and agreeing a shortlist
of candidates.
The chairman considered a full list of
candidates with MWM Consulting. The full
list was shared with the committee, who
also considered candidates put forward
independently by committee members.
A shortlist of candidates to be invited for
interview was agreed.
Committee evaluation 2018/19
We carried out an internal evaluation led by the chairman and the company secretary. This entailed questionnaires completed by members
and attendees, the output of which was discussed and debated by the committee.
Key areas of focus Suggested actions
Non-executive succession • Review the skills and experience of non-executive directors
• Discuss plan and next steps for non-executive succession.
Talent management and succession
planning for executives
• Greater focus on senior executive succession planning
• Regular reporting on how senior executives are performing and their
development needs.
Board diversity • Continue to review the composition of the Board and discuss plans to improve
diversity in all its forms.
Jan du Plessis
Chair of the Nominations Committee
8 May 2019
Board changes 2018/19
June
2018
July
2018
October
2018
Announced that Gavin
Patterson would step
down as chief executive
later in the year.
October
2018
March
2019
Philip Jansen announced
as successor to Gavin
Patterson. Appointed
from 1 January 2019 as
an executive director and
as chief executive from
1 February 2019.
Allison Kirkby joined
the Board,
Audit &
Risk
and
Nominations
Committees
with eect
from 15 March 2019.
Karen Richardson
and Tony Ball stepped
down from the Board
at the end of the AGM
on 11 July 2018.
Matthew Key joined
the Board,
Audit &
Risk
and
Nominations
Committees
with eect
from 25October 2018.
Nominations Committee continued
Chair’s report continued

69
BT Group plc Annual Report 2019 Strategic report
Governance
Financial statements
Additional information
Membership and key responsibilities
The committee acts independently of the executive. Its
members are all independent non-executive directors of the
company, with diverse skills and experiences. The committee
as a whole has competence relevant to the sector. Matthew
Key, Allison Kirkby and I have recent and relevant nancial
experience, as required by the provisions of the Code and we
are the designated nancial experts for Sarbanes-Oxley Act
purposes.
Attendance
Member
Eligible
to attend Attended
Nick Rose (chair) 9 9
Iain Conn 9 9
Matthew Key
a
3 3
Allison Kirkby
b
0 0
Karen Richardson
c
4 3
Jasmine Whitbread 9 9
a
Matthew was appointed to the committee on 25 October 2018.
b
Allison was appointed to the committee on 15 March 2019.
c
Karen stepped down from the committee on 11 July 2018.
The company secretary is secretary to the committee and
attends all meetings. The chairman and chief executive have
attended the majority of
Audit & Risk Committee
meetings
during the year. Other attendees include:
Regular
attendee
Attends as
required
Chief financial officer
Director, group finance
Director of risk, compliance & assurance
External auditors
a
Group general counsel
External reporting & financial controls director
Enterprise risk management director
Ethics & compliance director
a
PwC attended the April, May and June 2018 meetings in their capacity as auditors for the
2017/18 financial year. KPMG also observed these meetings and were appointed as BT’s
external auditors at the conclusion of the 2018 AGM.
The committee met nine times during the year. Meetings
are scheduled in line with the nancial reporting timetable.
As chair of the
Audit & Risk Committee,
I meet with the
regular attendees ahead of meetings to discuss key areas of
committee focus. After each meeting, reports are made to the
Board on the committee’s activity, the main issues discussed
and matters of particular relevance, with the Board receiving
copies of the committee minutes. The external auditors were
not present at meetings where their performance and/or
remuneration was discussed.
During the year, we held several separate sessions with BT’s internal
and external auditors, in the absence of management.
The
Audit & Risk Committee’s
key responsibilities are set out in the
committee’s terms of reference available on our website.
Activities in 2018/19
Pension valuation
In July 2018, the group announced that it had been alerted to an
error made by its independent external actuary in the actuary’s
calculation of the IAS 19 accounting valuation of retirement
benet obligations at 31 March 2018. The error resulted from the
incorrect application of changes to demographic assumptions.
The committee focused on understanding and challenging
management on their assessment of this error, including whether
it required restatement of published nancials and re-ling of the
2017/18 nancial statements on Form 20-F, and that the error
constituted a material weakness in the operation of the group’s
internal controls. Subsequently, the committee has overseen
management’s actions in strengthening their internal controls
to ensure they appropriately addressed the previously identied
material weakness. Further detail on the restatement of the group’s
results can be found on page 118.
Internal control status
Management is responsible for establishing and maintaining an
adequate system of internal control. The committee is responsible
for overseeing the eectiveness of these controls. Last year,
I reported on management’s implementation of a number of
enhancements to processes and controls across the group, in
response to the internal control deciencies related to our Italian
business. I also reported that management was creating a new
central nancial controls and assurance team, who would set and
maintain controls, policies and standards going forward.
During the year, management continued the improvements and
commenced a signicant Sarbanes-Oxley control enhancement
programme. The new second line of defence nancial controls
and assurance team is leading on this group-wide programme,
with support from Deloitte and Ernst & Young. This involved
documenting our in-scope end-to-end processes and related
Sarbanes-Oxley controls. As a result, a greater number of processes
and controls, operating to lower materiality, are now within our
Sarbanes-Oxley control scope.
The committee has monitored the ongoing implementation of
this enhancement programme, including overseeing the key risk
areas. The programme identied two particular areas requiring
remediation, partly associated with the wider scope: IT general
controls and risk assessment, in particular, documentation of
information used in controls. Although signicant improvements
have been made, remediation and testing of all remediating plans
was not complete at 31 March 2019. Management has therefore
concluded that our internal control over nancial reporting was
not eective as at 31 March 2019, under Sarbanes-Oxley, in
relation to IT general controls and risk assessment. Management
has detailed remediation plans which are intended to be completed
Audit & Risk Committee
Chair’s report

70
BT Group plc Annual Report 2019
in nancial year 2019/20. The committee will continue to monitor
management’s progress in their remediation activities.
The committee has monitored the status of management’s
remediation and overseen the steps taken to conclude that these
material weaknesses do not result in any identied misstatements
in the current period nancial statements nor any prior year
nancial statements.
Management has also carried out an assessment of our close
procedures, which resulted in more detailed and holistic quarterly
reviews, improved quality and timeliness of reviews, as well as
reduced duplication and increased standardisation. The committee
continues to focus on monitoring and overseeing management
on these improvements to governance, compliance and nancial
safeguards.
The new nancial controls and compliance team has continued
the programme of detailed balance sheet reviews, previously
undertaken by Ernst & Young, including in our operations outside
the UK. All actions resulting from these reviews have been tracked
and monitored and the reviews have not identied signicant
issues or areas of concern.
One BT Integrity and Compliance programme
In September, management brought together, under new leadership,
our risk management, compliance, internal audit and some second
line assurance functions, with the intent of managing risk and
providing assurance in a more co-ordinated and simplied way.
To extend and sustain the benets of this across the organisation,
management has launched a new programme called ‘One BT
Integrityand Compliance’. This programme is designed to ensure the
organisation has the optimal framework of risk management, controls
Audit & Risk Committee continued
Chair’s report continued
Key matters considered by the Audit & Risk Committee
April 2018
– Openreach board audit risk & compliance
committee (OBARCC) report
– External audit and non-audit fees
– Sarbanes-Oxley
– Update on full year results and draft
Annual Report & Form 20-F 2018
– External auditor report
– Internal audit plan and internal audit charter
– Ethics & compliance and Speak Up cases.
May 2018 (two meetings)
– Risk management, internal control and
compliance enhancements
– Sarbanes-Oxley
– 2017/18 full year results
– Annual Report & Form 20-F 2018, including
a review to ensure the report
was fair, balanced and understandable
– Going concern and viability statement
– Pensions accounting
– External and internal audit reports
– Major litigation, competition and
regulatory law
– Financial commitments and liabilities
– General Data Protection Regulation
compliance.
June 2018
– Review of the year end
– Finance transformation programme
– IT general controls and IT asset management
– Regulatory nancial statements 2017/18
– Security risk management
– Ethics & compliance, including ethical culture
and controls and Speak Up cases.
December 2018
– IT user access management, IT asset
management and payment card industry data
security standard (PCI DSS)
– Privacy and data governance
– Supplier risk and assurance
–
BT Compliance Committee
chair report
– Sarbanes-Oxley
– Ethics & compliance, regional governance
committees update and SpeakUp cases
– International audit coverage and trend
analysis.
January 2019
– Third quarter results
– Sarbanes-Oxley
– External and internal audit reports
– Developments in nancial reporting,
statutory audit and regulatory oversight
– India regional governance committee
– Financial commitments and liabilities
– PCI DSS
– Non-audit fees
– Litigation, employment, competition and
regulatory law.
April 2019 (two meetings)
– 2018/19 full year results
– Annual Report 2019, including a review
to ensure the report was fair, balanced and
understandable
– Viability and going concern statements
– Tax and pension matters
– Sarbanes-Oxley
– External and internal audit reports
– Internal Audit Charter
– Committee evaluation
– External auditor eectiveness
– External audit and non-audit fees
– Major litigation, competition and regulatory
law
– One BT Integrity and Compliance programme
– Openreach internal audit
– Annual Relevant Turnover Returns
– Data Subject Access Requests.
July 2018
– Openreach internal audit
– FRC audit quality review
– First quarter results
– Pension valuation
– External and internal audit reports
– Regulatory nancial statements 2017/18
– Risk management, internal control and
compliance enhancements
– Sarbanes-Oxley
– Non-audit fees
– Major litigation, competition and regulatory
law.
September 2018
– Risk updates from the chief executive
and the CEOs of the customer-facing units
and Technology.
October 2018
– Openreach board audit risk & compliance
committee (OBARCC) report
– External auditors’ engagement letter
– One BT Integrity and Compliance programme
– External audit and non-audit fees
– Half year results
– External and internal audit reports
– Going concern assessment
– External audit plan 2018/19
– Ethics & compliance
– Financial commitments and liabilities
– Corporate income tax accounting
– Major competition, regulatory law and
litigation
– Annual Report process review
– Sarbanes-Oxley.

71
BT Group plc Annual Report 2019 Strategic report
Governance
Financial statements
Additional information
and assurance for dealing with our landscape of risk and uncertainty;
and the right culture to support it. Improvements to date include
the launch of a new code of conduct and the BT Way, as well as new
training on fraud and the three lines of defence. The committee will
continue to receive updates on the programme’s progress.
BT Compliance Committee
The
BT Compliance Committee
, a sub-committee of the
Audit & Risk
Committee
, oversees BT’s compliance with the Commitments made as
part of the 2017 Digital Communications Review (DCR) with Ofcom.
The committee met six times in 2018/19. As chair of the
Audit & Risk
Committee
, I have sight of agendas and minutes of
BT Compliance
Committee
meetings.
Isabel Hudson, chair of the
BT Compliance Committee
, provided an
update to the
Audit & Risk Committee
during the year on the work
undertaken in its rst full year of operation, in relation to BT’s nancial
planning process, the strategic framework, culture and behaviours and
DCR outcomes.
The
BT Compliance Committee
will publish a separate report on its
activities for 2018/19 and this will be available on our website.
Financial reporting
The committee considered and assessed:
• the Annual Report and the annual, half year and quarterly
trading announcements for recommendation to the Board
• the quality and appropriateness of accounting policies and
practices, as well as critical accounting estimates and key
judgements
• whether the Annual Report, taken as a whole, is fair, balanced
and understandable and provides the information necessary for
shareholders to assess the group’s position and performance,
business model and strategy. This assessment formed the basis
of the advice given to the Board.
Signicant issues considered in relation to the nancial statements
Group accounting policies, critical accounting
estimates and judgements
The committee considered the accounting policies and disclosures
in the consolidated nancial statements that relate to critical
accounting estimates and judgements, the key judgements and
assumptions in relation to provisions, including restructuring,
regulatory risks and litigation, the assumed level of take-
up in the BDUK programme (which aects the value of our
potential obligation to re-invest or repay grant funding), the
implementation processes for the adoption of IFRS 15, Revenue
from Contracts with Customers, and IFRS 16, Leases, and the
impacts and key judgements on the group’s accounting when
adopted.
Going concern
Management’s forecasts of group cash ows and net debt, as
well as our liquidity requirements and the borrowing facilities
available to the group were considered. Following this review
and a discussion of the sensitivities, we conrmed that the going
concern basis of accounting continues to be an appropriate basis
of preparation for the nancial statements. Further detail on the
basis of the going concern assessment by the directors is set out
on page 92.
Viability statement
The process and assessment of the group’s prospects, the time
horizon and how this aligned with the group’s long-term forecasts,
taking into account the company’s current position and principal
risks, was assessed. The committee also considered the group risks
included in management’s stress testing model. The committee
was satised that the viability statement could be provided, and
endorsed the continued selection of a three-year time horizon as
a basis for the statement and the approach to its development.
Further detail on the assessment of viability and the viability
statement are set out on page 54.
Regulatory reporting
We were supportive of the changes across people, processes
and systems that were put in place to ensure that we met our
2018/19 regulatory nancial reporting obligations.
Pensions
The assumptions underlying the valuation of the pension liabilities in
the nancial statements, the nancial assumptions as summarised
in note 20 to the nancial statements, the sensitivities around the
assumptions and the impact of the assumptions on the balance
sheet, income statement and related disclosures were considered.
Goodwill impairment
We considered and were satised with the key assumptions,
including operating cash ow forecasts, resulting headroom and
the sensitivity analysis performed by management and agreed that
no goodwill impairment charges were required this year.
Major contracts
The performance of major contracts in Enterprise, Global Services,
the Emergency Services Network contract and EE, specically, were
considered. Management regularly monitors BT’s exposure to major
contracts and the updates to the committee included overviews
of the trading and operational performance of the contracts,
assessments of the recoverability of dedicated contract assets,
assessments of the future performance of the contracts and any
requirement for loss provisions.
Asset verication and asset lives
The results of management’s annual asset life review, asset
verication exercise and review of fully depreciated assets were
considered and we were satised that the judgements taken and
the methodology applied were appropriate.
Other matters
Specic items were reviewed quarterly, and we considered
whether they were appropriately categorised. We also considered
management’s view of the quality of earnings and of the
eective tax rate. At the half year and full year, we considered a
detailed assessment of provisions and at each quarter and the
full year, the committee was satised with the analysis provided
in relation to the results.
External audit
Last year, I reported on the external audit tender process we had
undertaken. Following the audit tender process, KPMG were
appointed as our external auditors at the conclusion of the 2018
AGM. A change in our external auditors has provided additional
challenge and a fresh perspective through which to assess our
controls. Tony Cates is the lead audit partner for KPMG, and
commenced his tenure on the appointment of KPMG. The company
conrms that it complied with the provisions of the Competition

72
BT Group plc Annual Report 2019
and Markets Authority’s Order for the nancial year under review.
The committee reviewed with the auditors the scope of work and
the risk informing this, external audit ndings and the letter of
engagement. The committee approved KPMG’s audit plan and the
letter of representation. Further information can be found in the
Independent auditors’ report on pages 101 to 109.
Auditor independence, objectivity and eectiveness
The committee discussed independence matters and areas that
could give rise to a conict of interest and safeguards that the
external auditors have in place to prevent compromising their
independence and objectivity. BT has policies in place detailing
non-audit services that can be provided by the external auditors.
The external auditors are not permitted to perform any work
which they may later be required to audit or which might aect
their objectivity and independence, or create a conict of
interest. Internal procedures describe the approval process for
work performed by the external auditors. This applied to KPMG
throughout the year and to PwC until they stepped down. The
committee monitored compliance with the policies and procedures
and considered business relationships with the external auditors,
and the level and appropriateness of non-audit services and fees.
Further details of the non-audit services that are prohibited and
allowed under the policy can be found on our website. Details
of non-audit services carried out by the external auditors are
described in note 9 to the consolidated nancial statements. Audit-
related assurance services, including the audit of the regulatory
nancial statements, are considered a low threat to auditor
independence. The proportion of other non-audit services to total
services is therefore considered the most suitable measure of the
non-audit services provided. These represented 6% of the total
fees (2017/18: 6%).
The committee also reviewed the quality of the audit and the
performance of the external auditors. We concluded they were
independent and recommended to the Board that they be re-appointed.
In addition, during the year, the Financial Reporting Council’s Audit
Quality Review Team (AQRT) reviewed PwC’s audit of the group’s
2017/18 nancial statements as part of their annual inspection of
audit rms. I received and reviewed the nal report from the AQRT
which indicated that there were no signicant areas of concern.
Internal audit
The committee:
• reviewed and approved the annual internal audit plan at the
start of the year and received regular updates on audit activities,
progress against the plan, details of unsatisfactory audits and
action plans to address these
• reviewed the performance of the function twice during the year.
We commissioned an external eectiveness review of internal
audit in 2018/19. This was conducted, in accordance with our
ve-year cycle of such reviews, by the Chartered Institute of
Internal Auditors
• reviewed overdue recommendations and ensured these are
tracked through to completion and subject to close monitoring
by management.
Risk management
Each quarter, all customer-facing units certify the adequacy and
eectiveness of their risk management processes and the operation
of their Sarbanes-Oxley controls. BT’s risk management processes,
which have been in place throughout the period under review,
identify and monitor the risks facing the group. The
Executive
Committee
and the Board regularly review the risks that are
considered material.
During the year, the chief executive and the CEOs of each
customer-facing unit and Technology (or their delegates),
presented to the committee on the enterprise-wide risk
management process, the key risks facing the group and the units,
and the operation of the three lines of defence. The escalation of
issues and how material risks are identied, evaluated and managed
were also discussed.
The Board is ultimately responsible for the group’s system of risk
management and internal control. See page 96 for further details.
See US Regulation on page 94 for details on internal controls
assessment for the purposes of the Sarbanes-Oxley Act.
Governance and compliance
We received and considered reports from management on
BT’s ethics and compliance priorities, including Speak Up. We
ensure that arrangements are in place for the proportionate and
independent investigation of these and other matters, including
privacy and data governance and anti-corruption and bribery.
Audit & Risk Committee continued
Chair’s report continued
Committee evaluation 2018/19
We carried out an internal evaluation of the committee led by the chairman and the company secretary. This entailed questionnaires completed
by members, attendees and KPMG (our external auditors); the output of which was discussed and debated by the committee.
Key areas of focus Suggested actions
Risk management • Further review of the quality, reliability and resilience of key controls, especially
nancial and IT controls, and to verify our risks
• Refresh and maintain knowledge levels; increase ‘deep dive’ reviews across our
key risks and nancial controls.
Meetings • Further time for debate and challenge at meetings.
Composition • Continue to keep the committee composition under review.
Nick Rose
Chair of the Audit & Risk Committee
8 May 2019

Report on Directors’ remuneration
Chair’s letter
73
BT Group plc Annual Report 2019 Strategic report
Governance
Financial statements
Additional information
The contents of this report
are as follows:
Membership and key responsibilities
• Determine the salary and bene ts for the executive
directors, members of the
Executive Committee
and the
company secretary, and monitor the relationship between
pay and bene ts of other employees
• Operation of the annual bonus scheme, including setting
performance targets and objectives for the year ahead
• Determine awards under the annual bonus scheme
for executive directors and review the awards of other
senior executives
• Governance of the long-term incentive plans, including
target setting
• Review and approve the Annual Remuneration Report
for inclusion in the Annual Report
• Review, approve and ensure operation within the
Remuneration Policy including seeking shareholder
approval, on a binding basis, at least every three years.
Attendance
Member
Eligible
to attend Attended
Nick Rose (chair )
a
10 10
Tony Ball
b
3 3
Isabel Hudson 10 10
Mike Inglis 10 10
Karen Richardson
c
3 2
a
Nick was appointed chair of the committee on 12 July 2018.
b
Tony stepped down as chair of the committee on 11 July 2018.
c
Karen stepped down as a member of the committee on 11 July 2018.
In addition to the committee members, the chairman and
chief executive are invited to attend meetings, except in
instances where their own remuneration is discussed or other
circumstances where their attendance would not be appropriate.
The committee regularly consults the chief executive, the group
HR director, and the director of reward .
The company secretary is secretary to the committee and
attends all meetings.
Chair ’s letter
Review of the year; committee decisions; key
outturns and plans for the year ahead
pages 73 to 75
Focus on remuneration
The key aspects of our remuneration structure, risk
management, how we have performed, how we
applied the Remuneration Policy during 2018/19
and application in 2019/20
pages 76 to 78
Annual Remuneration Report
More detail on how we have applied our
Remuneration Policy during 2018/19 including
the single gure of remuneration for each director
How we intend to apply the Remuneration Policy
in 2019/20
pages 73 to 90
This is my fi rst report since taking over as chair of the
committee in July 2018. On behalf of the committee,
I would like to thank my predecessor, Tony Ball, for his
leadership and contribution. There is no doubt that this
is a particularly challenging time for all remuneration
committees to balance the legitimate views of all
stakeholders in the area of executive remuneration
and associated governance.

74
BT Group plc Annual Report 2019
Report on Directors’ remuneration continued
Chair’s report continued
Listening to shareholders
The interests of our shareholders underpin the committee’s oversight
of our Remuneration Policy and payments to executive directors.
The committee was therefore disappointed with the vote against
our Annual Remuneration Report at the 2018 AGM. Following that
meeting, I met with some of our shareholders and prominent proxy
advisory bodies to understand why they voted against our Annual
Remuneration Report. It was reassuring to hear that shareholders
did not have any material concerns with our overall Remuneration
Policy. Rather, some shareholders felt that the annual bonus pay-out
last year did not align with the overall share price performance. In
addition, there was concern around the amount of annual bonus paid
to Gavin Patterson given the Board’s announcement, shortly after its
bonus decision, that Gavin would be stepping down.
I explained to shareholders that, in line with best practice, the
committee had applied its discretion to reduce bonuses for all
executive directors down to target levels despite the formulaic results
yielding a higher bonus. However, given the signicant share price
fall over 2017/18, some shareholders felt the reduction in bonus
was not sucient. The committee discussed shareholders’ feedback
at length. In response, we have implemented a new process whereby,
in reviewing performance against the formulaic targets under our
various incentive plans, we will give greater weight to a broader
range of performance factors and circumstances, including share
price performance, when determining the overall outcome.
I have continued the dialogue with some of our shareholders,
particularly in relation to the 2018/19 bonus outcomes. I’d like to
thank those shareholders who have taken the opportunity to engage
with me. The committee has carefully considered these views when
making its nal decisions.
Business performance
This year has once again been dicult for the committee in balancing
the performance achieved with remuneration outcomes. Although
reported numbers indicate a broadly at performance year-on-year,
management has had to overcome signicant headwinds impacting
EBITDA including regulatory price reductions of £252m, cost
ination (including the eect of cumulo rate increases) of £362m
and declines in xed voice of £179m. The nal outcome for the year
as a whole was therefore very creditable and allowed us to report
numbers at the top end of market expectations.
The committee noted further progress this year in meeting our year-
on-year customer service targets, with Group Net Promoter Score up
6.5 points and Right First Time up 5.4%, continuing improvement
over eleven consecutive quarters. Customer complaints to Ofcom
reduced by a third for both BT’s consumer broadband and EE’s mobile
customers.
Investment and delivery in our core networks have signicantly
improved with accelerated bre-to-the-premises (FTTP) build and
ambition, doubling the number of premises passed to 1.2 million at
the lower end of the cost range (£300-£400), and achieving around
2 million premises passed with G Fast. EE has retained the ‘best
mobile network’ position for the fth consecutive year in the 2018
RootMetrics survey and we are on track to launch 5G in 16 cities in
2019 with a range of device partners.
All of this has been achieved against a backdrop of very signicant
organisational change as part of the rst phase of transformation.
The restructuring programme has achieved annualised cost savings
of £875m and enabled us to simplify our business and systems and
to de-layer our organisation. Ofcom has recognised the ‘signicant
progress’ made in its reports of June and November 2018 and the
committee recognised that much has been done in the year to rebuild
our relationship with Ofcom to put us on a better footing for future
strategic discussions.
And we have navigated the additional challenge of a chief executive
transition, with an orderly and well controlled handover, and with real
progress on delivery of our transformation agenda, which is critical to
building the foundations for growth and success in the future.
The committee also recognises that despite much good work during
the year, as I write this letter our share price has remained essentially
at this year, albeit marginally outperforming the sector.
Reward outcomes for the year
Performance relative to our nancial and customer experience
targets led to a formulaic annual bonus outcome of just over 146%
of target for the executive directors. However, considering the overall
shareholder experience, the broadly at earnings performance and
the insucient progress we have made in closing the customer
service gap versus our competition, the committee exercised its
discretion to reduce the annual bonus outturn relative to the nancial
and customer experience targets to 115% of target. This resulted in
Philip Jansen and Simon Lowth receiving an annual bonus of 134%
and 137% of salary, respectively. More information on the 2018/19
annual bonus is on pages 80 and 81.
In the three-year period 1 April 2016 to 31 March 2019, the group
performed below threshold against the revenue, free cashow and
relative total shareholder return targets under the 2016 Incentive
Share Plan (ISP) award. This resulted in no payment being made
under the 2016 ISP. More information on the 2016 ISP is on
page81.
Chief executive changes
Departure of Gavin Patterson
When we announced Gavin’s departure from BT last June, the
Board felt we did not have an internal successor and wanted the
opportunity to conduct an extensive external search to identify
the best possible candidate to lead the company in the next phase
of its development. The Board therefore concluded at that time
that it was in the company’s best interests to ask Gavin to remain
in place to ensure the best continuity and the smoothest transition
possible to a new chief executive. As part of Gavin’s commitment to
do this, the committee agreed that he would be eligible for a bonus
based on the overall nancial outcomes and his personal objectives
including delivery of key strategic programmes (eg 5G and FTTP to
plan), rebuilding trust and reputation with the regulator, developing
and implementing a new operating model, the delivery of the
digital communications review with Ofcom and ensuring a seamless
transition to the new chief executive.

75
BT Group plc Annual Report 2019 Strategic report
Governance
Financial statements
Additional information
The committee has reviewed Gavin’s overall performance for the
year in the light of these objectives and concluded that the personal
element of his bonus would merit an on target outcome. This
reects the role Gavin played in a seamless transition to Philip as our
new chief executive, and the momentum sustained in progressing
our transformation programme. However, having concluded on
the formulaic outcomes for Gavin, the committee was keen to get
input from some of our major shareholders, knowing full well that
shareholders and society at large expect remuneration committees to
exercise discretion more frequently, especially when an executive is
leaving an organisation.
We received a broad range of views representing some of our largest
shareholders, including our largest shareholder Deutsche Telekom.
Having listened carefully to this feedback and after discussion with
Gavin, the committee and Gavin agreed that a reduction of the total
bonus outcome by 50% would be the right thing to do and in the
best interests of all stakeholders. This resulted in Gavin receiving
an annual bonus of 56% of target. Further details can be found on
page81. In addition, the committee exercised its discretion and, with
Gavin’s agreement, decided that his 2017 ISP should lapse in full.
(Gavin was not awarded a 2018 ISP.) This has been a dicult decision
and a dicult year for the committee to balance all the relevant
factors.
Appointment of Philip Jansen
During the year we welcomed our new chief executive, Philip Jansen,
a proven leader with exceptional experience in managing large and
complex businesses. In considering Philip’s remuneration package,
the committee sought to balance the desire to secure his services
with adherence to our Remuneration Policy. Throughout, we were
guided by the views of shareholders and the provisions of the new
UK Corporate Governance Code (the new Code) published by the
Financial Reporting Council in July 2018. Philip has made a really
excellent start as chief executive. However as detailed on page 81
the committee felt that the personal element of his bonus should be
capped at 50% of maximum given the short period in question.
As detailed in the appointment announcement on 25 October 2018,
Philip’s base salary is £1,100,000, which is xed for ve years.
He receives our standard executive benets package and a cash
allowance in lieu of pension of 15% of salary in line with the wider
management population in the UK. Philip’s incentive opportunities
are in line with our Remuneration Policy, with a maximum annual
bonus of 240% of salary and a maximum ISP award of 400% of
salary. His annual bonus for 2018/19 has been pro-rated to reect
his period of service. He was awarded a 2018 ISP in February 2019.
This recognises that he will be leading BT’s progress towards these
targets for most of the three-year performance period. The award
was made at a reduced level of 300% of salary to recognise that he
joined part-way through the rst year.
Philip also received an award with a face value of £895,848 to
compensate him for his loss in shares forfeited from Worldpay, his
previous employer. The buy-out award mirrors the value and terms
of the original award forfeited. Following the announcement that
FIS will acquire Worldpay, Worldpay has conrmed the original award
will vest in full. Therefore, Philip’s BT buy-out award will also vest in
full on 20 March 2020, subject to continued employment. Philip has
voluntarily agreed to hold any vested shares for a further year.
As communicated at the time of appointment, Philip invested nearly
£2m in purchasing BT shares in November 2018.
2019 remuneration
We are not proposing any major changes to our executive director
remuneration in 2019. Our chief nancial ocer, Simon Lowth,
will receive a salary increase of 2.5%, in line with that for the wider
workforce, while Philip Jansen is not eligible for an increase as the
committee agreed on his appointment to x his base pay for ve
years.
In terms of the 2019 ISP awards, the committee has reviewed
the level of ISP award for Philip Jansen and Simon Lowth and
agreed awards of 400% and 350% respectively in line with our
Remuneration Policy. Recognising the need to ensure that our
remuneration arrangements support the delivery of BT’s strategy
under Philip’s stewardship, the committee has delayed agreeing
the ISP 2019 performance conditions. The intention is that awards
will be granted in June 2019 and full details of the performance
conditions will be disclosed in advance of the AGM.
Corporate governance
The committee welcomes the new Code. We are already aligned
with the new provisions in several areas. For example, approval of
remuneration for the
Executive Committee
already falls within our
remit. We also now consider a broader range of performance factors
and wider circumstances when determining incentive pay-outs
and do not simply follow the formulaic outcome. Finally, we took
the opportunity to align the pension provision for our new chief
executive to that of the wider management population in the UK,
reecting society’s sentiment in this area.
We have also chosen to disclose our chief executive pay ratio for
2018/19. This is set out on page 87.
Looking ahead
2019 will be another busy year for the committee. Our primary aim is
to ensure that executive pay continues to support the delivery of our
business strategy, and that outcomes are appropriately aligned with
shareholders’ interests.
We will put our Remuneration Policy to shareholders for approval at
the 2020 AGM. Ahead of this, we will carry out a thorough review of
our remuneration framework and metrics, recognising the need to
ensure that our arrangements support the delivery of BT’s strategy
under Philip Jansen’s stewardship and best align executive rewards
with shareholder rewards and any new Code provisions. We will
consult with shareholders on any proposals during the year, and I look
forward to an open and constructive dialogue.
We will further develop our compliance with the new Code, with
a close eye on wider market practice, the expectations of our
stakeholders and, of course, what is in the best interests of BT.
Finally, I would like to thank our shareholders for taking the time
to engage with us over the course of the year and I look forward to
seeing you at our 2019 AGM.
Nick Rose
Chair of the Remuneration Committee
8 May 2019

76
BT Group plc Annual Report 2019
Focus on remuneration
How we align our remuneration policy with shareholders’
interests and risk management
76
BT Group plc Annual Report 2019
Base salary and core benefits
Alignment with shareholders’ interests Risk management
• Forms a key part of the remuneration framework required to attract,
retain and motivate the calibre of executives needed to shape and
execute our strategy and generate shareholder value.
• Loss of existing talent and an inability to recruit new talent would
represent a risk to the business
• Mitigated by setting salary and benets at a level that is competitive
against relevant businesses and recognises breadth of the role and
individual experience.
Application in 2018/19 Application for 2019/20
• An increase of 2.5% for Gavin Patterson and Simon Lowth
was applied in June 2018
• Base salary for Gavin Patterson of £1,022,000 and for
Simon Lowth £717,500
• Gavin Patterson and Simon Lowth received a cash pensions
allowance of 30% of salary
• Philip Jansen’s remuneration package was agreed upon appointment
with a base salary of £1,100,000 xed for ve years and a cash
pension allowance of 15% of salary
• Benets include company car, fuel or driver, personal
telecommunication facilities and home security, medical and dental
cover (for the directors and immediate family), life cover, professional
subscriptions, personal tax advice and nancial counselling.
• An increase of 2.5% for Simon Lowth to be applied in June 2019
• No change to Philip Jansen’s base salary
• There are no changes being proposed to the benet framework
or pension arrangements for 2019/20 for Philip Jansen or
Simon Lowth.
Annual bonus
Alignment with shareholders’ interests Risk management
• Financial and personal objectives are set with reference to our business
strategy approved by the Board
• Focused on KPIs for the business, including:
– EPS, free cash ow and revenue (excluding transit)
– Delivering great customer service
– Strategic objectives linked to key operational and strategic projects
• Deferral of one-third of the bonus for three years provides retention
and alignment over the longer term.
• The Board seeks to ensure that the budget balances achievable goals
without encouraging undue risk, with incentive targets aligned with
delivering the budget
• The nancial metrics reect how well management mitigates our
principal business risks
• The committee retains absolute discretion to reduce variable
compensation in light of risk and the group’s overall performance
and circumstances
• Bonus deferral encourages a focus on long-term outcomes
• Malus and clawback provisions are in place.
Application in 2018/19
Application for 2019/20
• The maximum level of bonus opportunity was 240% for Gavin
Patterson and Philip Jansen, and 180% for Simon Lowth
• Performance relative to our nancial and customer experience targets
led to formulaic annual bonus outcome of 146.5% of target for the
executive directors
• The committee exercised its discretion to reduce the nancial and
customer experience annual bonus outturn to 115% of target.
This resulted in an annual bonus of 56% of maximum for
Philip Jansen and 76% of maximum for Simon Lowth
• Having concluded on the formulaic outcome for Gavin Patterson,
listened carefully to shareholder feedback, and following discussion
with Gavin, the committee and Gavin agreed that a reduction of the
total bonus outcome by 50% would be the right thing to do and in the
best interests of all stakeholders. This resulted in an annual bonus of
28% of maximum for Gavin Patterson.
• No changes are being proposed to the maximum bonus opportunities
or to the overall structure of the annual bonus
• Minor changes are being made to the way some of our performance
metrics are measured to ensure that they remain fully aligned with the
business’ main areas of focus
• Change to revenue measure to be inclusive of transit revenue, to
reect how we are reporting in our quarterly nancial statements
• Introduction of Keeping Our Promises measure in place of Right First
Time to reect that this provides a better measure of meeting
the commitments we make and providing more reliable services
for our customers.

77
BT Group plc Annual Report 2019 Strategic report
Governance
Financial statements
Additional information
77
BT Group plc Annual Report 2019 Strategic report
Governance
Financial statements
Additional information
Our remuneration principles are to
maintain a competitive remuneration
package that promotes the long-
term success of the business, avoids
excessive or inappropriate risk taking
and aligns management’s interests
with those of shareholders.
We believe in pay for performance against challenging targets and
stretching goals for the annual bonus and long-term incentive
shares. A signicant proportion of the total remuneration package
is therefore variable and linked to corporate performance.
In applying these principles, the committee determines the
remuneration policy for the executive directors and the chairman.
The chairman is not a member of the committee.
The committee:
• reviews the performance targets regularly to ensure that they
are both challenging and closely linked to the group’s strategic
priorities. Furthermore, because a large part of the remuneration
package is delivered in shares and senior executives are required
to build up a signicant shareholding themselves, they are
directly exposed to the same gains or losses as all
other shareholders.
• takes account of the pay and employment conditions of all our
employees, the performance of the group and the individual,
the current views and guidelines of shareholders and their
representatives, and general market conditions. Remuneration
arrangements at other companies of a similar size and complexity
are also reviewed for guidance.
• continues to keep under review the relationship of risk to
remuneration. The chair of the
Audit & Risk Committee
is chair
of the
Remuneration Committee
.
• ensures that the incentive structure for senior executives
does not raise environmental, social or governance risks by
inadvertently motivating irresponsible behaviour. Part of the
annual bonus depends upon an assessment of each senior
executive’s personal contribution which typically includes the
environmental, social and governance agenda.
• retains absolute discretion to reduce variable compensation in
light of risk and the group’s overall performance and any other
factor it deems relevant.
Incentive Share Plan (ISP)
Alignment with shareholders’ interests Risk management
• Based on performance against free cash ow, revenue (excluding transit)
and total shareholder return
• Total shareholder return (TSR) metric provides a direct measure
of our relative performance against peers.
• Metrics balance internal and external nancial performance, producing a
rounded view of performance and eective risk management over the
longer term
• Two year holding period ensures individuals retain exposure to the share
price for at least ve years in total.
Application in 2018/19 Application for 2019/20
• No award for Gavin Patterson
• Philip Jansen received an award of 300% of salary in February 2019,
reduced from 400% to reect his joining part way through the
three-year performance period
• Simon Lowth received an award of 350% of salary.
• At the time of going to print, the ISP 2019 targets had not been set
bythe committee
• Full details of the performance measures will be disclosed in advance
ofthe AGM in July.
Shareholding guidelines
Alignment with shareholders’ interests Risk management
• Shareholding guidelines ensure appropriate alignment between
executives and investors
• Current shareholding levels are set out on page 83.
• Encourages executives to build and hold a material, personal stake
in the business
• Ensures that they have signicant equity at stake in the event
of adverse risk-related events.
Application in 2018/19 Application for 2019/20
• Gavin Patterson: equivalent to 300% of salary
• Philip Jansen: equivalent to 300% of salary
• Simon Lowth: equivalent to 250% of salary.
• No changes are being proposed.

78
BT Group plc Annual Report 2019
The Remuneration Report is colour-coded as follows:
Fixed pay Annual bonus
Annual bonus,
deferred bonus
Incentive
Share Plan (ISP)
Pay breakdown
The pay breakdown for the executive directors in 2017/18 and 2018/19 is set out below.
Gavin Patterson
a
Former chief executive
£000
3,000
2,500
2,000
1,500
1,000
500
0
1,353 1,292
2017/ 8
b
1,147
2018/19
c
Philip Jansen
Current chief executive
£000
3,000
2,500
2,000
1,500
1,000
500
0
2017/18 2018/19
d
Simon Lowth
Chief nancial ocer
£000
3,000
2,500
2,000
1,500
1,000
500
0
2017/18 2018/19
c
Annual bonus for 2018/19
The resulting bonus outcomes as a percentage of base salary were:
Gavin Patterson (pro-rated to reect the period he was in full-time employment during the year)
Simon Lowth
240%
maximum opportunity
67%
2018/19 Outcome:
=
180%
maximum opportunity
137%
2018/19 Outcome:
=
1/3
deferred shares
2/3
cash bonus
1/3
deferred shares
2/3
cash bonus
a
Gavin stood down from the Board at midnight on 31 January 2019.
b
The group returned below threshold performance against all of the performance measures for the 2015 ISP. No payment was made.
c
The group returned below threshold performance against all of the performance measures for the 2016 ISP. No payment was made.
d
Philip was appointed to the Board on 1 January 2019 and became chief executive on 1 February 2019. His rst ISP award was made in February 2019.
Fixed
£
Base salary
n/a 275
Benets
n/a 39
Pension
n/a 41
Variable
£
Annual bonus
(shares)
n/a 123
Annual bonus
(cash)
n/a 247
ISP (shares)
n/a n/a
Fixed
£
Base salary
997 847
Benets
57 46
Pension
299 254
Variable
£
Annual bonus
(shares)
431 191
Annual bonus
(cash)
861 381
ISP (shares)
0 0
Fixed
£
Base salary
700 715
Benets
23 24
Pension
210 214
Variable
£
Annual bonus
(shares)
302 327
Annual bonus
(cash)
605 655
ISP (shares)
n/a 0
Vesting of 2016 ISP award
The ISP is a conditional share award with three performance conditions measured over a three-year performance period.
The group returned below-threshold performance against all of the performance measures for the 2016 ISP. This resulted
in no payment being made.
40%
Total Shareholder Return
40%
Normalised free cash ow
20%
Underlying revenue growth (excluding transit)
Performance Outcome
Threshold 12
th
20
th
= threshold not met
Performance Outcome
Threshold £10.70bn £8.19bn = threshold not met
Performance Outcome
Threshold 2.1% (2.19)% = threshold not met
355
n/a
370
Philip Jansen (pro-rated to reect the period he was in full-time employment during the year)
240%
maximum opportunity
134%
2018/19 Outcome:
=
1/3
deferred shares
2/3
cash bonus
933 907
953 982
572
Focus on remuneration continued
78
BT Group plc Annual Report 2019

79
BT Group plc Annual Report 2019 Strategic report
Governance
Financial statements
Additional information
This section summarises all elements of the directors’ remuneration in 2018/19.
References to ‘audited’ refer to an audit performed in accordance with UK statutory reporting requirements. For US purposes,
disclosures have not been audited from a Public Company Accounting Oversight Board perspective.
Single total gure of remuneration (audited)
The following sets out all emoluments received by directors for the nancial years 2018/19 and 2017/18, including bonus and deferred
bonus, long-term incentive share plans (ISP) and pension arrangements.
Base salary
and fees
(2018/19)
£000
Base salary
and fees
(2017/18)
£000
Benets
excluding
pension
(2018/19)
£000
Benets
excluding
pension
(2017/18)
£000
Pension
a
(2018/19)
£000
Pension
(2017/18)
£000
Annual
Bonus
b
(2018/19)
£000
Annual
Bonus
(2017/18)
£000
ISP
c
(2018/19)
£000
ISP
d
(2017/18)
£000
Malus
e
2017/18
Total
2018/19
£000
Total
2017/18
£000
Chairman
Jan du Plessis 700 322 24 43 724 365
Executive directors
Philip Jansen
f
275 – 39 – 41 – 370 – – – – 725 0
Simon Lowth 715 700 23 23 214 210 982 907 – – – 1,934 1,840
Non-executive directors
Iain Conn 124 122 124 122
Tim Höttges
g
– – 0 0
Isabel Hudson
h
157 188 3 1 160 189
Mike Inglis
h
126 105 2 2 128 107
Matthew Key
h,i
39 1 40 0
Allison Kirkby
j
3 3 0
Nick Rose
h
171 173 1 2 172 175
Jasmine Whitbread 134 107 134 107
Sub-total 2,444 1,717 93 71 255 210 1,352 907 – – – 4,144 2,905
Former directors
Gavin Patterson
k
847 997 46 57 254 299 572 1,292 – – -338 1,719 2,307
Tony Ball
h,l
36 138 1 2 37 140
Karen Richardson
h,m,n
36 127 8 31 44 158
Total 3,363 2,979 148 161 509 509 1,924 2,199 – – -338 5,944 5,510
a
Pension allowance paid in cash for the nancial year – see ‘Total pension entitlement’
on page 81.
b
Annual bonus shown includes both the cash and deferred share element. The deferred
element of the 2018/19 bonus includes the value of deferred shares to be granted in June
2019. Further details of the deferred element are set out on page 81.
c
The ISP 2016 granted in June 2016 will lapse in full. Further details are provided
on page 81.
d
The ISP 2015 granted in June 2015 lapsed in full in May 2018.
e
As a result of investigations into improper accounting practices in BT’s Italian business,
the committee exercised its discretion and applied the malus provisions under the deferred
bonus plan. This was applied in May 2017 and the gure was calculated based on the share price
at the original grant.
f
Philip was appointed as a director on 1 January 2019 and became chief executive
from 1 February 2019.
g
Under the terms of the Relationship Agreement between BT and Deutsche Telekom
and Tim’s letter of appointment, no remuneration is payable for this position.
h
Value shown relates to reimbursement of reasonable travelling and other expenses (including
any relevant tax) incurred in carrying out their duties.
i
Matthew was appointed as a director on 25 October 2018.
j
Allison was appointed as a director on 15 March 2019.
k
Gavin stood down as a director at midnight on 31 January 2019.
l
Tony retired as a director on 11 July 2018.
m
Karen retired as a director on 11 July 2018.
n
Includes an additional fee for regular travel to Board and board committee meetings.
Annual remuneration report
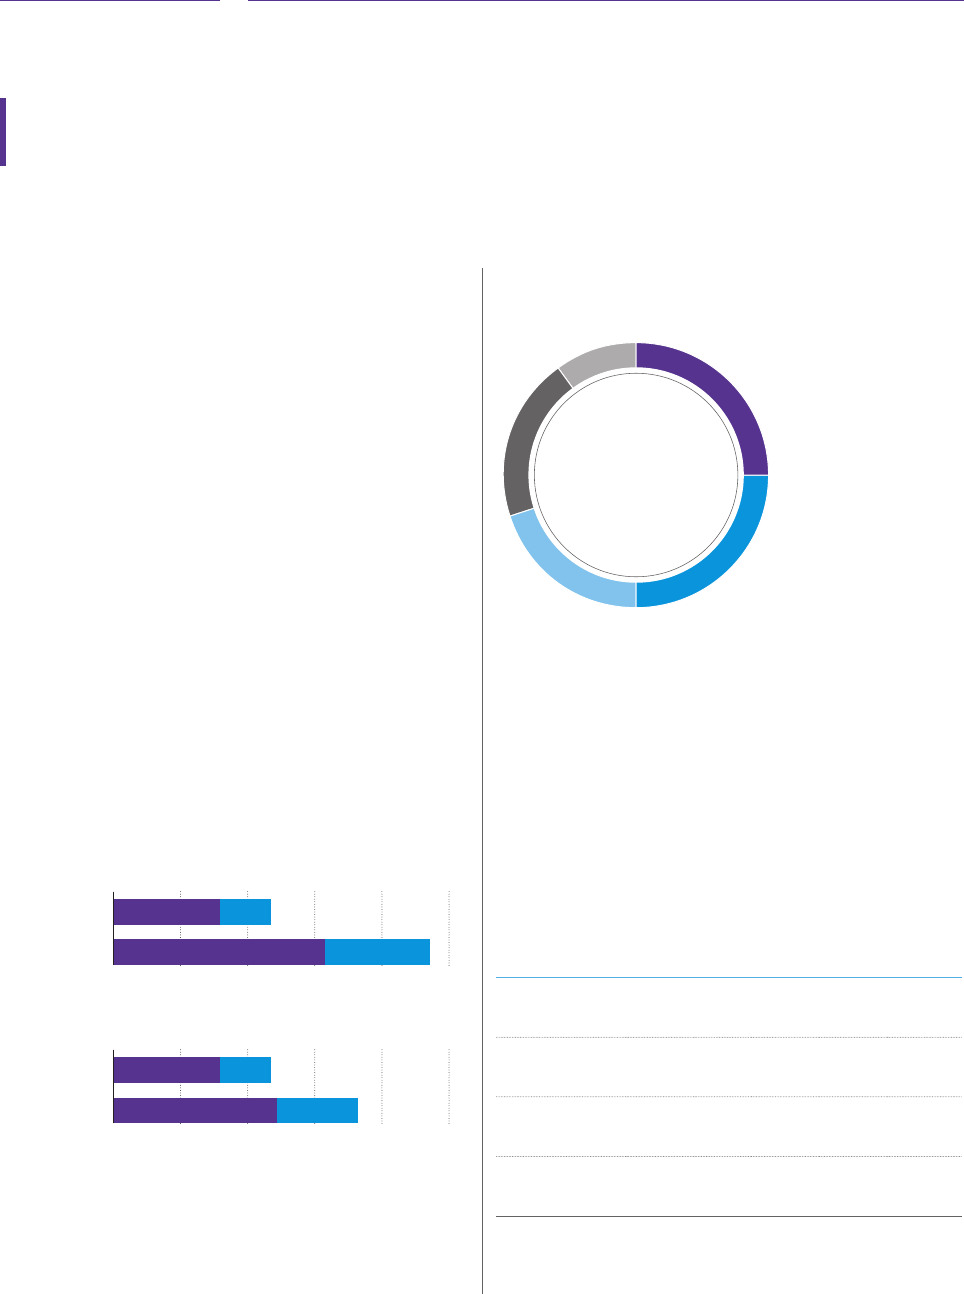
80
BT Group plc Annual Report 2019
Additional disclosures relating
to the single gure table (audited)
Salaries
Executive directors’ salaries are reviewed annually, with increases
typically eective from 1 June. We reviewed the salaries for Gavin
Patterson and Simon Lowth during the year and agreed a 2.5%
increase in line with increases for the UK management population
and a lower increase than that given to team members. The new base
salaries were £1,022,000 and £717,500 respectively. We agreed
Philip Jansen’s salary of £1,100,000 (xed for ve years) at the time
of his appointment in January 2019.
The annualised pay settlement for our team members in the UK
in2018/19 was 3.1%.
Benets
Benets provided to the executive directors and the chairman include
company car, fuel or driver, personal telecommunication facilities
and home security, medical and dental cover (for the directors and
immediate family), life cover (executive directors only), professional
subscriptions, personal tax advice and nancial counselling.
Annual bonus
The annual bonus opportunities (expressed as a percentage of salary)
for the executive directors in 2018/19 were as follows:
Chief executive
Target
Maximum
0%
80%
160% 80%
40%
50 100 150 200
250
Chief financial officer
Target
Maximum
0%
80%
120% 60%
40%
50 100 150 200
250
● Cash ● Deferred shares
The annual bonus opportunities for the chief executive applied to
Gavin Patterson and Philip Jansen during their respective time in the
role as chief executive.
We set out below the weighting of the annual bonus structure for the
executive directors in 2018/19.
1. Adjusted earnings per share 25%
2. Normalised free cash flow 25%
3. Customer experience 20%
4. Personal objectives 20%
5. Revenue (excluding transit) 10%
1
2
3
4
5
The annual bonus is based on performance against key nancial and
non-nancial metrics, and personal objectives. Key measures under
the nancial and non-nancial elements include adjusted earnings per
share, cash ow, revenue (excluding transit) and customer experience.
As set out in the table below, the formulaic results against targets
produced an above-target outcome across all of the measures.
However, considering the overall shareholder experience, the
broadly at earnings performance and the insucient progress
we have made in closing the customer service gap versus our
competition, the committee exercised its discretion to reduce
the annual bonus outturn relative to the nancial and customer
experience targets to 115% of target.
Measure Threshold Target Stretch Actual Outcome
Adjusted EPS (p)
a
24.6 25.9 27.8 26.3
Between
target and
stretch
Normalised
free cash ow (£m)
b
2,270 2,389 2,569 2,440
Between
target and
stretch
Revenue (excluding
transit) (£m) 22,848 23,079 23,425 23,300
Between
target and
stretch
Customer
experience 50 100 200 164.13
Between
target and
stretch
a
Adjusted EPS is dened on page 31.
b
Normalised free cash ow is dened on page 31.
Annual remuneration report continued
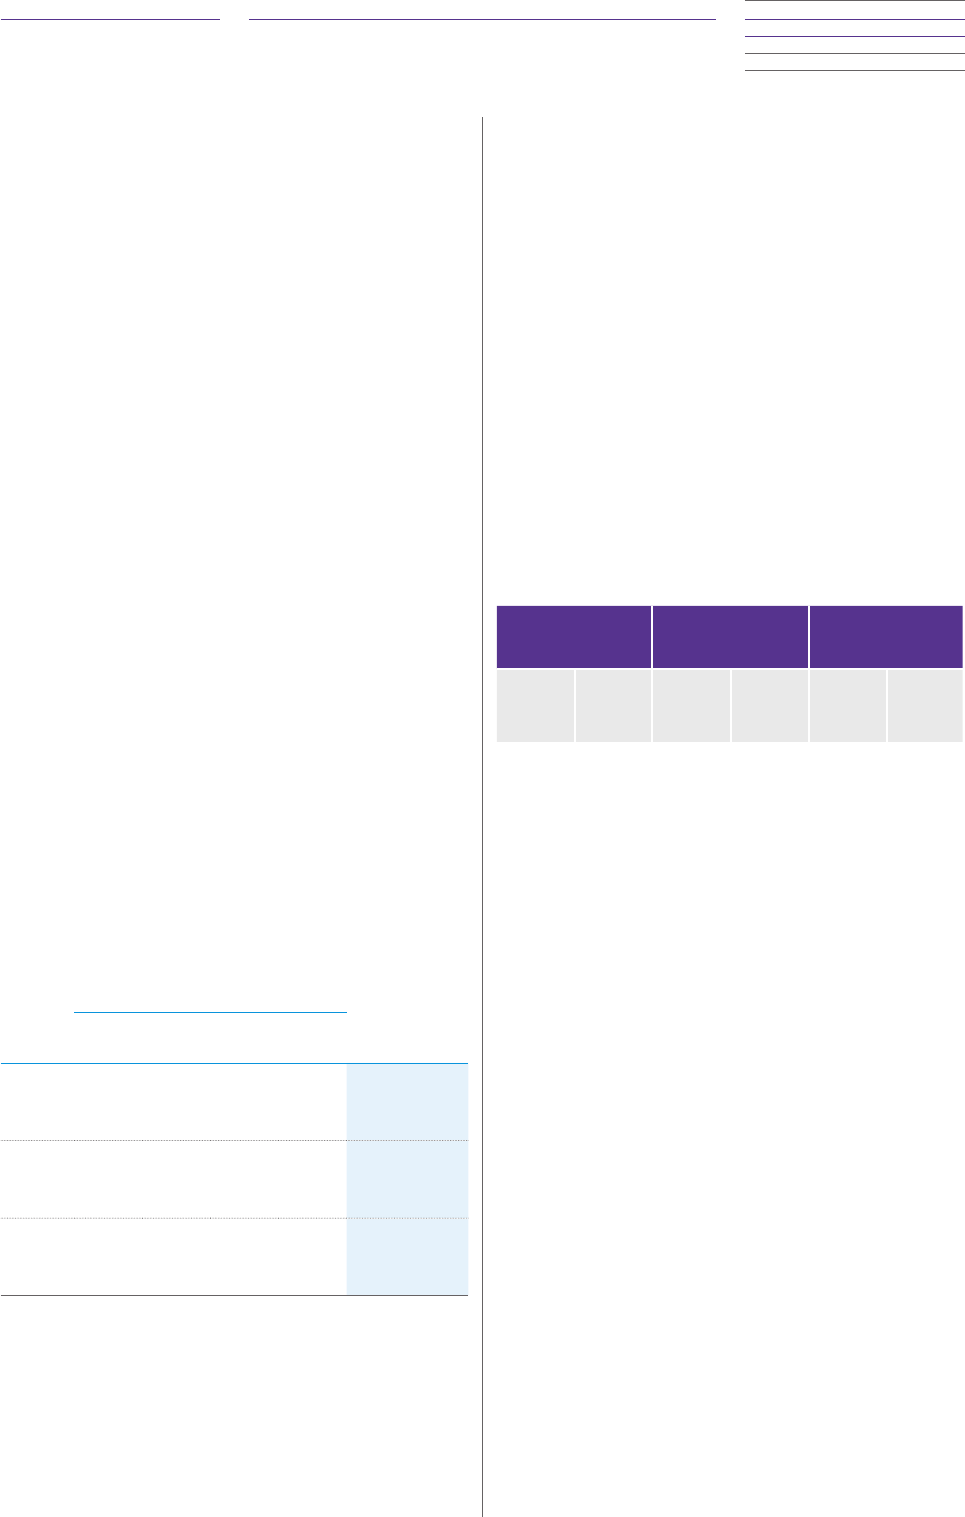
81
BT Group plc Annual Report 2019 Strategic report
Governance
Financial statements
Additional information
The assessment of performance against personal objectives
was carried out by the chairman for Gavin Patterson and Philip
Jansen, and by Gavin Patterson for Simon Lowth. In addition, the
Nominations Committee
reviewed the performance of the executive
directors as part of a wider
Executive Committee
performance review.
These assessments were based on a number of factors including
BT’s regular employee surveys and performance against personal
objectives set at the start of the year.
Gavin Patterson achieved 50% of maximum for his personal
contribution score. This reected Gavin’s progress against the
delivery of key strategic programmes (eg 5G and FTTP to plan),
rebuilding trust and reputation with the regulator, developing and
implementing a new operating model, the delivery of the digital
communications review with Ofcom and ensuring a seamless
transition to Philip Jansen. Having concluded on the formulaic
outcomes for Gavin, listened carefully to shareholder feedback, and
following discussion with Gavin, the committee and Gavin agreed
that a reduction of the total bonus outcome by 50% would be the
right thing to do and in the best interests of all stakeholders.
Philip Jansen achieved 50% of maximum for his personal
contribution score. Philip has made an excellent start in the role
as chief executive. However, given that he is new to the role, the
committee felt that target level of achievement was appropriate
and consistent with how we treat other new joiners in the company.
Simon Lowth achieved 90% of maximum for his personal
contribution score. In addition to successfully delivering this year’s
nancial outturns, Simon has demonstrated stand-out leadership
in transforming the nance function. This has included improving
our risk management processes, strengthening our controls,
and bolstering the team with new skills and experience. He has
also helped with the transition of the Strategy & Transformation
function to Michael Sherman. As a member of the Openreach
board, he played an important role in delivering the Digital
Communications Review.
The table below sets out the total bonus outturns:
Financial and customer
service measures
(80% weighting)
Personal
objectives
(20% weighting)
Overall bonus
Formulaic
outcome
Following
discretion
Formulaic
outcome
Following
discretion
Gavin
Patterson
146.5%
of target
57.5%
of target
100%
of target
50%
of target
28% of maximum
67% of salary
£381,547 cash/
£190,773 shares
Philip
Jansen
146.5%
of target
115%
of target
100%
of target
100%
of target
56% of maximum
134% of salary
£246,400 cash/
£123,200 shares
Simon
Lowth
146.5%
of target
115%
of target
140%
of target
140%
of target
76% of maximum
137% of salary
£654,360 cash/
£327,180 shares
For executive directors, one-third of any bonus paid is deferred into
shares for three years with the remaining two-thirds paid in cash.
Deferred shares are not subject to performance conditions.
Gavin Patterson’s bonus, paid both in cash and deferred shares,
represented 67% of salary (pro-rated to reect the period he was
chief executive during the year) (2017/18: 130%) and 28% of the
maximum bonus opportunity (2017/18: 54%).
Philip Jansen’s bonus, paid both in cash and deferred shares,
represented 134% of salary (pro-rated to reect the period he was
in full-time employment during the year) (2017/18: N/A) and 56%
of the maximum bonus opportunity (2017/18: N/A).
Simon Lowth’s bonus, paid both in cash and deferred shares,
represented 137% of salary (2017/18: 130%) and 76% of the
maximum bonus opportunity (2017/18: 70%).
The deferred shares will be granted in June 2019.
Incentive share plan 2016 (audited)
The ISP is a conditional share award. The committee assesses the
performance conditions to 31 March 2019 and the awards would
ordinarily vest in May 2019. The performance conditions are based
40% on relative TSR, 40% on normalised free cash ow, and 20%
on growth in underlying revenue (excluding transit) over a three-
year performance period.
As set out in the table below, the threshold performance target in
respect of each measure was not met and therefore no payment
was made.
40% Total Shareholder
Return
40% Normalised
free cash ow
20% Underlying
revenue growth
(excluding transit)
Performance
Threshold
12th
Outcome
20th =
threshold
not met
Performance
Threshold
£10.70bn
Outcome
£8.19bn =
threshold
not met
Performance
Threshold
2.1%
Outcome
(2.19)%=
threshold
not met
Total pension entitlements (audited)
We closed the BT Pension Scheme (BTPS) to new entrants on 31
March 2001. None of the executive directors participate in future
service accrual in the BTPS.
New UK employees are eligible to join a dened contribution
scheme, typically a personal pension plan. For executive directors,
the company agrees to pay a xed percentage of the executive’s
salary each year which can be put towards the provision of
retirement benets.
Philip Jansen receives an annual allowance equal to 15% of salary
in lieu of pension provision as set out in the table on page 79. Philip
has not previously been a member of any of the company pension
schemes. BT also provides death in service cover consisting of a
lump sum equal to four times his salary.
Gavin Patterson receives an annual allowance equal to 30% of
salary in lieu of pension provision as set out in the table on page79.
Gavin has previously been a member of the BT Retirement Saving
Scheme (BTRSS) but neither he nor the company has made any
contribution to the scheme during 2018/19. BT also provides
death in service cover consisting of a lump sum equal to four times
his salary plus a dependant’s pension equal to 30% of his capped
salary.
Simon Lowth receives an annual allowance equal to 30% of salary
in lieu of pension provision as set out in the table on page 79.
Simon has not previously been a member of any of the company
pension schemes. BT also provides death in service cover consisting
of a lump sum equal to four times his salary plus a dependant’s
pension equal to 30% of his capped salary.
Jan du Plessis is not a member of any of the company pension
schemes. The company has made no payments towards his
retirement provision and provided no life cover benet.

82
BT Group plc Annual Report 2019
Awards granted during the year (audited)
2018 ISP awards
The 2018 ISP awards were made in June 2018 and February 2019
as set out below and on page 85. Despite serving as chief executive
for almost a year of the performance period, no award was made
to Gavin Patterson on the basis of him stepping down as chief
executive at the end of January 2019.
The award for Simon Lowth was 350% of salary.
To reect his joining part way through the three-year performance
period, an award of 300% of salary was made to Philip Jansen.
Director Date of award
ISP award
(shares)
Face value
of award
Philip Jansen
a
1 February 2019 1,412,872 £3,299,056
Simon Lowth
b
19 June 2018 1,190,071 £2,511,248
a
Face value based on share price at the date of grant of 233.56p. The grant price is calculated using the
average middle-market price of a BT share for the three days prior to grant.
b
Face value based on share price at the date of grant of 211.02p. The grant price is calculated using the
average middle-market price of a BT share for the three days prior to grant.
The ISP is a conditional share award. Performance conditions
attached to the awards are based on: 40% relative TSR, 40%
normalised free cash ow, and 20% growth in underlying revenue
excluding transit over a three-year performance period from 1 April
2018 to 31 March 2021. The performance conditions are the same
for both directors. The table below sets out the pay-out ranges for
TSR, the normalised free cash ow and underlying revenue growth
excluding transit for the three-year performance period 2018/19
to 2020/21.
TSR position
Proportion vesting
(of TSR portion of award)
Proportion vesting
(of overall award)
1-5 100.0% 40.0%
6 81.3% 32.5%
7 62.50% 25.0%
8 43.75% 17.5%
9 25.00% 10.0%
10-17 0.00% 0.0%
As disclosed in the 2018 Directors’ Remuneration Report,
the committee agreed a revised comparator group of 16 other
companies for the 2018 awards as set out below.
Centrica Proximus Telecom Italia
Deutsche Telekom Sky Telefónica
KPN SSE Telenor
Liberty Global Swisscom Telia Company
National Grid TalkTalk Vodafone
Orange
Financial targets
Measure
2018/19–2020/21 Threshold
Level of
vesting Maximum
Level of
vesting
a
Normalised free
cash ow £6.4bn 25% £7.4bn 100%
Underlying
revenue growth
(excluding transit) 0.2% 25% 1.9% 100%
a
Vesting levels between threshold and maximum will be on a straight line basis.
When setting the targets, the committee takes into account
the budget, medium-term plan and consensus at the time. The
committee believes the performance ranges for free cash ow and
revenue measures are challenging, and the nancial performance
necessary to achieve the upper end of the range for each measure
is stretching.
When ISP awards vest, additional shares representing the value of
reinvested dividends on the underlying shares are added.
The awards are subject to a further holding period of two years,
commencing from the end of the performance period and applied
to the net number of shares received after tax and other statutory
deductions. During the holding period, no further performance
measures will apply.
2018 deferred shares (DBP)
We awarded a proportion of the 2017/18 annual bonus in deferred
shares. The table below provides further details.
Director Date of award
DBP award
(shares)
Face value
of award
a
Gavin Patterson 19 June 2018 204,072 £430,626
Simon Lowth 19 June 2018 143,306 £302,400
a
Face value based on share price at grant of 211.02p. The grant price is calculated using the average
middle-market price of a BT share for the three days prior to grant.
The DBP is a conditional share award. Deferred shares are not
subject to performance conditions and have a three-year vesting
period. Details of all interests in deferred shares are set out on
page85.
When DBP awards vest, additional shares representing the value of
reinvested dividends on the underlying shares are added.
Joining arrangements for Philip Jansen
During the year we welcomed our new chief executive, Philip
Jansen, a proven leader with exceptional experience in managing
large and complex businesses. In considering Philip’s remuneration
package, the committee sought to balance the desire to secure his
service with adherence to our Remuneration Policy. Throughout,
we were guided by the views of shareholders and the provisions of
the new Code.
Annual remuneration report continued

83
BT Group plc Annual Report 2019 Strategic report
Governance
Financial statements
Additional information
Philip’s base salary is £1,100,000, which is xed for ve years.
He receives our standard executive benets package and a cash
allowance in lieu of pension of 15% of salary in line with our wider
management population in the UK. Philip’s incentive opportunities
are in line with our Remuneration Policy, with a maximum annual
bonus of 240% of salary and a maximum ISP award of 400% of
salary. His annual bonus for 2018/19 has been pro-rated to reect
his period of service. He was awarded a 2018 ISP in February
2019. This recognises that he will be leading BT’s progress towards
the targets for most of the three-year performance period. To
recognise that he joined part-way through the rst year, the award
was made at a reduced level of 300% of salary.
Philip also received an award with a face value of £895,848 to
compensate him for his loss in shares forfeited from Worldpay, his
previous employer. The buy-out award mirrors the value and terms
of the award forfeited. Following the announcement that FIS will
acquire Worldpay, Worldpay have conrmed the original award will
vest in full. Therefore, Philip’s BT buy-out award will also vest in full
on 20 March 2020, subject to continued employment. Philip has
voluntarily agreed to hold any vested shares for a further year until
20 March 2021.
Director Date of award
RSP award
(shares)
Face value
of award
a
Philip Jansen 1 February 2019 370,798 £895,848
a
Face value based on share price at grant of 241.6p. The grant price is calculated using the closing
share price on 17 October 2018.
Payments for loss of oce (audited)
Gavin Patterson stood down as a director at midnight on
31January 2019. Under the terms of his service contract, he will
continue to receive his salary and contractual benets until the
end of his notice period, being 25 October 2019. These pro-
rated payments will total £777,489 salary and fees, £15,000
benets and £225,000 pension allowance. Gavin will receive
no compensation or payment for the termination of his service
contract or his ceasing to be a director of the company or any other
group company, although BT will pay outplacement fees of up to
£40,000 and legal fees of up to £9,000.
Former directors (audited)
Phil Hodkinson retired as a non-executive director on 31 January
2016 and was a member of the
Committee for Sustainable and
Responsible Business
until standing down on 31 January 2019.
He received an annual fee of £10,000 as a member of this
committee.
Directors’ share ownership (audited)
The committee believes that the interests of the executive directors
should be closely aligned with those of shareholders.
The chief executive is required to build up a shareholding equal
to 300% of salary, and the chief nancial ocer 250% of salary.
The aim is to encourage the build up of a meaningful shareholding
in the company over time by retaining shares received under an
executive share plan (other than shares sold to meet tax and other
statutory deductions) or from purchases in the market.
We use the average BT share price over the preceding 12 months
(or the share price at acquisition date if higher) to determine
whether the minimum shareholding requirement has been reached.
The table below sets out the shareholding position as at 31 March
2019. As a new director, Philip has not yet received any vested
shares under the executive share plans. Details of his buy-out are
included on page 86 the award will vest in full on 20 March 2020
and Philip has voluntarily agreed to hold the shares for a further
one year until 20 March 2021. Philip invested nearly £2m in
purchasing shares in the market in November 2018.
Gavin Patterson is required to maintain a shareholding equivalent to
300% of salary until the end of his notice period, being 25October
2019.
Executive director
Personal shareholding
as a percentage of salary
Gavin Patterson
a
919%
Philip Jansen 180%
Simon Lowth 51%
a
Gavin stood down from the Board at midnight on 31 January 2019 and the percentage reects
his personal shareholding at that date.
The following table shows the total unvested interests held by
the executive directors in the ISP and DBP, and for Philip Jansen
the RSP. The numbers represent the maximum possible vesting
levels. The ISP awards will only vest to the extent the performance
conditions are met over the three-year period. Full details of all
ISP and DBP awards, including performance periods and vesting
conditions, are set out on page 85.
Unvested interests in shares (audited)
ISP (subject to
performance)
DBP (not subject to
performance)
RSP (subject to
Worldpay performance)
1 April
2018
Total
number
of award
shares
31 March
2019
1 April
2018
Total
number
of award
shares
31 March
2019
1 April
2018
Total
number
of award
shares
31 March
2019
Gavin Patterson
a
3,354,841 2,537,389 127,638 253,742 – –
Philip Jansen
b
– 1,441,160 – – – 378,221
Simon Lowth
1,568,600 2,947,475 44,397 200,548 – –
a
Gavin stood down from the Board at midnight on 31 January 2019 and the number
reects his awards at that date.
b
Philip joined the Board in January 2019 and will be granted his rst DBP award
in June 2019.
During the period 1 April 2019 to 8 May 2019, there were no
movements in unvested interests in shares.

84
BT Group plc Annual Report 2019
Directors’ interests at 31 March 2019 or date of retirement,
if earlier (audited)
The following table shows the benecial interests of directors
holding oce at the end of the year (or at the point of leaving for
directors who retired during the year), and their families, in the
company’s shares at 31 March 2019 and 1 April 2018, or at date
of appointment if later.
Number of shares
Benecial holdings 31 March 2019 1 April 2018
Jan du Plessis 501,599 400,000
Gavin Patterson
a,b
2,958,405 2,943,453
Philip Jansen
c
771,313 770,500
Simon Lowth 157,379 10,536
Tony Ball
d
193,871 193,871
Iain Conn 19,442 19,442
Tim Höttges – –
Isabel Hudson 24,090 15,090
Allison Kirkby
e
– –
Mike Inglis 29,091 4,599
Matthew Key
f
31,000 –
Karen Richardson
g,h
13,525 13,525
Nick Rose 400,000 300,000
Jasmine Whitbread 11,832 11,289
Total 5,111,547 4,682,305
a
Gavin stood down as a director at midnight on 31 January 2019 and the number reects
his holding at that date.
b
Includes shares purchased under directshare and free shares awarded under UK allshare.
Directshare is an HMRC approved plan that allows BT employees to buy shares out of
gross pay. Prior to 2008 BT awarded free shares to UK employees (UK allshare).
c
Philip was appointed as a director on 1 January 2019. He purchased 770,500 shares in
the market in November 2018.
d
Tony retired as a director on 11 July 2018 and the number reects his holding
at that date.
e
Allison was appointed as a director on 15 March 2019.
f
Matthew was appointed as a director on 25 October 2018.
g
Karen retired as a director on 11 July 2018 and the number reects her holding
at that date.
h
Shares are held as 2,705 American Depositary Shares (ADS). One ADS equates to ve BT
ordinary shares.
During the period 1 April 2019 to 8 May 2019, there were no
movements in directors’ benecial holdings. The directors, as a
group, benecially own less than 1% of the company’s shares.
The company encourages the chairman and independent non-
executive directors to purchase, on a voluntary basis, BT shares
with an aggregate value of £5,000 on average each year to further
align the interests of non-executive directors with those of our
shareholders. The directors are asked to hold these shares until they
retire from the Board. This policy is not mandatory.
This policy does not apply to Tim Höttges who was appointed to
the Board as a non-independent, non-executive director following
completion of the EE acquisition in January 2016. This helps avoid
any conict of interest in relation to Tim’s ongoing employment as
CEO of Deutsche Telekom.
Annual remuneration report continued

85
BT Group plc Annual Report 2019 Strategic report
Governance
Financial statements
Additional information
Deferred bonus plan awards at 31 March 2019 (audited)
The following DBP awards have been granted to the directors. These shares will normally be transferred to participants at the end of the
three-year deferral period. Philip Jansen joined the Board on 1 January 2019 and is due to be granted his rst DBP award in June 2019.
1 April 2018 Awarded
a
Dividends
re-invested Vested Lapsed
Total number
of award shares
31 March 2019 Vesting date
Price at
grant
Market price
at vesting
Monetary
value of
vested award
£000
Simon Lowth
DBP 2017 44,397 – 3,038 – – 47,435 01/08/2020 286.40p – –
DBP 2018 – 143,306 9,807 – – 153,113 01/08/2021 211.01p – –
Former director
Gavin Patterson
DBP 2015 94,220 – – 94,220 – – 01/08/2018 449.50p 230.68p 217
DBP 2016 33,418 2,286 – – 35,704 01/08/2019 403.18p – –
DBP 2017
b
– – – – – – – – – –
DBP 2018 – 204,072 13,966 – – 218,038 01/08/2021 211.01p – –
a
Awards granted on 19 June 2018. The number of shares subject to awards was calculated using the average middle market price of a BT share for the three days prior to the grant.
Awards of deferred shares in respect of 2019 will be calculated using the average middle market price of a BT share for the three days prior to grant.
b
The committee exercised its discretion and determined that no bonus would be awarded to Gavin in respect of 2016/17. This resulted in no DBP award being granted in 2017.
Share awards under long-term incentive share plan (ISP) held at 31 March 2019 (audited)
Details of the company’s ordinary shares under conditional share awards made to directors, as participants under the ISP are as follows:
1 April 2018 Awarded
Dividends
re-invested Vested Lapsed
Total number
of award shares
31 March 2019
Performance
period end
Price on
grant
Market price
at vesting
Monetary
value of
vested
award
£000
Philip Jansen
ISP 2018
a
– 1,412,872 28,288 – – 1,441,160 31/03/2021 233.56p – –
Simon Lowth
ISP 2016
b
664,614 – 45,486 – – 710,100 31/03/2019 405.38p – –
ISP 2017
c
903,986 – 61,869 – – 965,855 31/03/2020 286.4p – –
ISP 2018
d
– 1,190,071 81,449 – – 1,271,520 31/03/2021 211.01p – –
Former director
Gavin Patterson
ISP 2015
e
979,988 – – (979,988) – 31/03/2018 449.5p – –
ISP 2016
f
1,087,543 – 74,432 – – 1,161,975 31/03/2019 403.18p – –
ISP 2017
c
1,287,310 – 88,014 – – 1,375,324 31/03/2020 286.4p – –
ISP 2018
g
– – – – – – – – – –
a
Award granted on 1 February 2019. The number of shares subject to award was
calculated using the average middle-market price of a BT share for the three days prior
to grant of 233.56p. 40% of each award is linked to TSR compared with a group of 17
companies, 40% is linked to a three-year normalised free cash ow measure and 20% to
a measure of underlying revenue growth (excluding transit) over three years.
b
Award granted on 29 July 2016. The number of shares subject to award was calculated
using the average middle market price of a BT share for the three days prior to grant of
405.38p. 40% of each award is linked to TSR compared with a group of 21 companies,
40% is linked to a three-year normalised free cash ow measure and 20% to a measure
of underlying revenue growth (excluding transit) over three years.
c
Award granted on 22 June 2017. The number of shares subject to award was calculated using
the average middle market price of a BT share for the three days prior to grant of 286.40p.
40% of each award is linked to TSR compared with a group of 21 companies, 40% is linked to
a three-year normalised free cash ow measure and 20% to a measure of underlying revenue
growth (excluding transit) over three years.
d
Award granted on 19 June 2018. The number of shares subject to award was calculated
using the average middle market price of a BT share for the three days prior to grant of
211.01p. 40% of each award is linked to TSR compared with a group of 17 companies,
40% is linked to a three-year normalised free cash ow measure and 20% to a measure
of underlying revenue growth (excluding transit) over three years.
e
Award granted on 18 June 2015. The number of shares subject to award was calculated
using the average middle market price of a BT share for the three days prior to grant of
449.50p. 40% of each award is linked to TSR compared with a group of 21 companies,
40% is linked to a three-year normalised free cash ow measure and 20% to a measure
of underlying revenue growth (excluding transit) over three years.
f
Award granted on 20 June 2016. The number of shares subject to award was calculated
using the average middle market price of a BT share for the three days prior to grant of
403.18p. 40% of each award is linked to TSR compared with a group of 21 companies,
40% is linked to a three-year normalised free cash ow measure and 20% to a measure
of underlying revenue growth (excluding transit) over three years.
g
The committee exercised its discretion and determined that no ISP would be awarded to
Gavin in respect of 2018/19.

86
BT Group plc Annual Report 2019
Retention share plan awards at 31 March 2019 (audited)
The following RSP award was granted to Philip Jansen. This is a buy-out award to compensate Philip for the loss in shares that he forfeited
on leaving Worldpay to join BT. In accordance with our approved Remuneration Policy, the buy-out mirrors the value and terms of the
award forfeited. The shares will vest on 20 March 2020 subject to continued employment and will only vest to the extent that the forfeited
award meets the original performance targets set by Worldpay. Following the announcement that FIS will acquire Worldpay, Worldpay has
conrmed the original award will vest in full. Philip has voluntarily agreed to hold any vested shares for a further one year until 20 March
2020.
Awarded
Dividends
re-invested Vested Lapsed
Total number of
award shares
31 March 2019 Vesting date
Price
at grant
Market
price
at vesting
Monetary
value of vested
award £000
1 April
2018
Philip Jansen
RSP 2018
– 370,798 7,423 – – 378,221 20/03/2020 241.6p – –
Share options held without performance conditons (saveshare) at 31 March 2019 (audited)
The directors exercised no saveshare options during the year. There were no vested but unexercised options at year-end.
Number of shares under option:
Granted Lapsed Exercised 31 March 2019
Option price
per share
Market price
at date of
exercise
Usual date
from which
exercisable
Usual expiry
date 1 April 2018
Former director
Gavin Patterson
a
5,642
b
– – –
5,642 319p – 01/08/2019 01/02/2020
All of the above options were granted for nil consideration.
a
Gavin stood down from the Board at midnight on 31 January 2019 and the number reects the number of shares under option at that date. The options are exercisable up to 31 July 2019.
b
Option granted on 26 June 2014 under the employee sharesave scheme, in which all employees of the company are entitled to participate.
Comparison of chief executive remuneration
to total shareholder return (unaudited)
Total shareholder return (TSR) is the measure of the returns that a
company has provided for its shareholders, reecting share price
movements and assuming reinvestment of dividends. The graph
opposite illustrates the performance of BT Group plc measured by
TSR relative to a broad equity market index over the past ten years.
We consider the FTSE 100 to be the most appropriate index against
which to measure performance, as BT has been a member of the
FTSE 100 throughout the nine-year period, and the index is
widely-used.
BT’s TSR performance vs the FTSE 100
0
300
200
100
400
500
600
700
800
900
Mar
10
Mar
09
Mar
11
Mar
12
Mar
13
Mar
14
Mar
15
Mar
16
Mar
17
Mar
18
Mar
19
BT FTSE 100
Source: Datastream
The graph shows the relative TSR performance
of BT and the FTSE 100 over the past ten years.
Annual remuneration report continued

87
BT Group plc Annual Report 2019 Strategic report
Governance
Financial statements
Additional information
History of chief executive remuneration
Year end Chief Executive
Total rem
£000
Annual bonus
(% of max)
ISP vesting
(% of max)
2019 Philip Jansen
a
725 56% N/A
Gavin Patterson
b
1,719 28% 0%
2018 Gavin Patterson 2,307 54% 0%
2017 Gavin Patterson 1,345 0% 0%
2016
b
Gavin Patterson 5,396 45% 82.01%
2015 Gavin Patterson 4,562 58% 67.4%
2014
c
Gavin Patterson 2,901 62% 78.7%
Ian Livingston
d
4,236 35% 63.4%
2013 Ian Livingston 9,402 65% 100%
2012 Ian Livingston 8,520 73% 100%
2011 Ian Livingston 4,009 79% 0%
2010 Ian Livingston 3,556 71% 0%
a
Philip was appointed as a director on 1 January 2019 and became chief executive from
1February 2019. His rst ISP award was made in February 2019.
b
Gavin stood down as chief executive at midnight on 31 January 2019 and Philip took over
from 1 February 2019.
c
The total remuneration gure includes the ISP award as CEO BT Retail and the rst award
as chief executive, granted in 2013.
d
Ian stepped down on 10 September 2013 and Gavin took over from that date.
Percentage change in chief executive remuneration
(unaudited)
The table below illustrates the increase in salary, benets and
annual bonus for Gavin Patterson and Philip Jansen in the role as
chief executive and that of a representative group of the company’s
employees. For these purposes, we’ve used the UK management
and technical employee population representing around 24,607
people. We believe this broad group provides the most meaningful
comparison as they have similar performance related pay
arrangements as our executive directors.
Salary Benets
a
Bonus
b
% Change in chief executive
remuneration 13% 49% (27)%
% Change in comparator group
c
2.5% 0% 15%
a
The increase in benets for the chief executive was around £28,000.
b
The bonus comparator is based on cash bonus only to give a better like-for-like comparison.
c
Comparator group is the UK management and technical employee population representing
around 24,607 individuals.
Chief executive pay ratio
The table below sets out the chief executive pay ratio as at
31March 2019. The report will build up over time to show a rolling
10-year period.
The ratios compare the single total gure of remuneration of the
chief executive with the equivalent gures for the lower quartile
(P25), median (P50) and upper quartile (P75) employees.
Chief executive remuneration £2,444,000
P25 employee remuneration £34,281
P50 employee remuneration £41,477
P75 employee remuneration £51,594
P25 employee pay ratio 71 : 1
P50 employee pay ratio 59 : 1
P75 employee pay ratio 47 : 1
A signicant proportion of the chief executive’s remuneration is
delivered through long term incentives, where awards are linked to
company performance and share price movements over the longer
term. This means that the ratios will depend signicantly on long-
term incentive outcomes and may uctuate from year to year. None
of the employees in the previous table participated in long-term
incentive plans.
Chief executive base pay
£1,122,000
P25 employee base pay
£30,090
P50 employee base pay
£35,918
P75 employee base pay
£41,740
P25 employee base pay ratio
37 : 1
P50 employee base pay ratio
31 : 1
P75 employee base pay ratio
27 : 1
Methodology
We have used ‘Option B’ (based on gender pay reporting).
The P25, P50 and P75 employees were identied from the
company’s gender pay report, together with the 80 employees
below and above each of the ‘P’ points to form enlarged groups.
This was to guard against volatility in the underlying data.
The total FTE remuneration of each employee in each of the groups
was calculated for the year ended 31 March 2019.
A median total remuneration gure for each ‘P’ group was
calculated, to produce a more representative result than relying on
a single employee from the company’s gender pay reporting.
Relative importance of spend on pay (unaudited)
The table below shows the change in total remuneration paid to all
employees and dividends paid and share buyback paid.
Area 2018/19 (£m) 2017/18 (£m) % change
Remuneration paid to
all employees 5,382 5,400 (0.3)%
Dividends/share buybacks 1,513 1,746 (13.3)%
Implementation of remuneration
policy in 2019/20 (unaudited)
Base salary
The committee considered the base salary for Simon Lowth. In line
with the increases agreed for our managerial employees, we agreed
a 2.5% salary increase eective in June 2019.
Philip Jansen’s base salary of £1,100,000 was agreed on
appointment and is xed for ve years. Therefore no increase will
be applied in 2019/20.
2019/20
Base salary % change
Philip Jansen
a
£1,100,000 0%
Simon Lowth £735,438 2.5%
a
Philip was appointed as a director on 1 January 2019 and became chief executive on
1 February 2019. His base salary is xed for ve years.
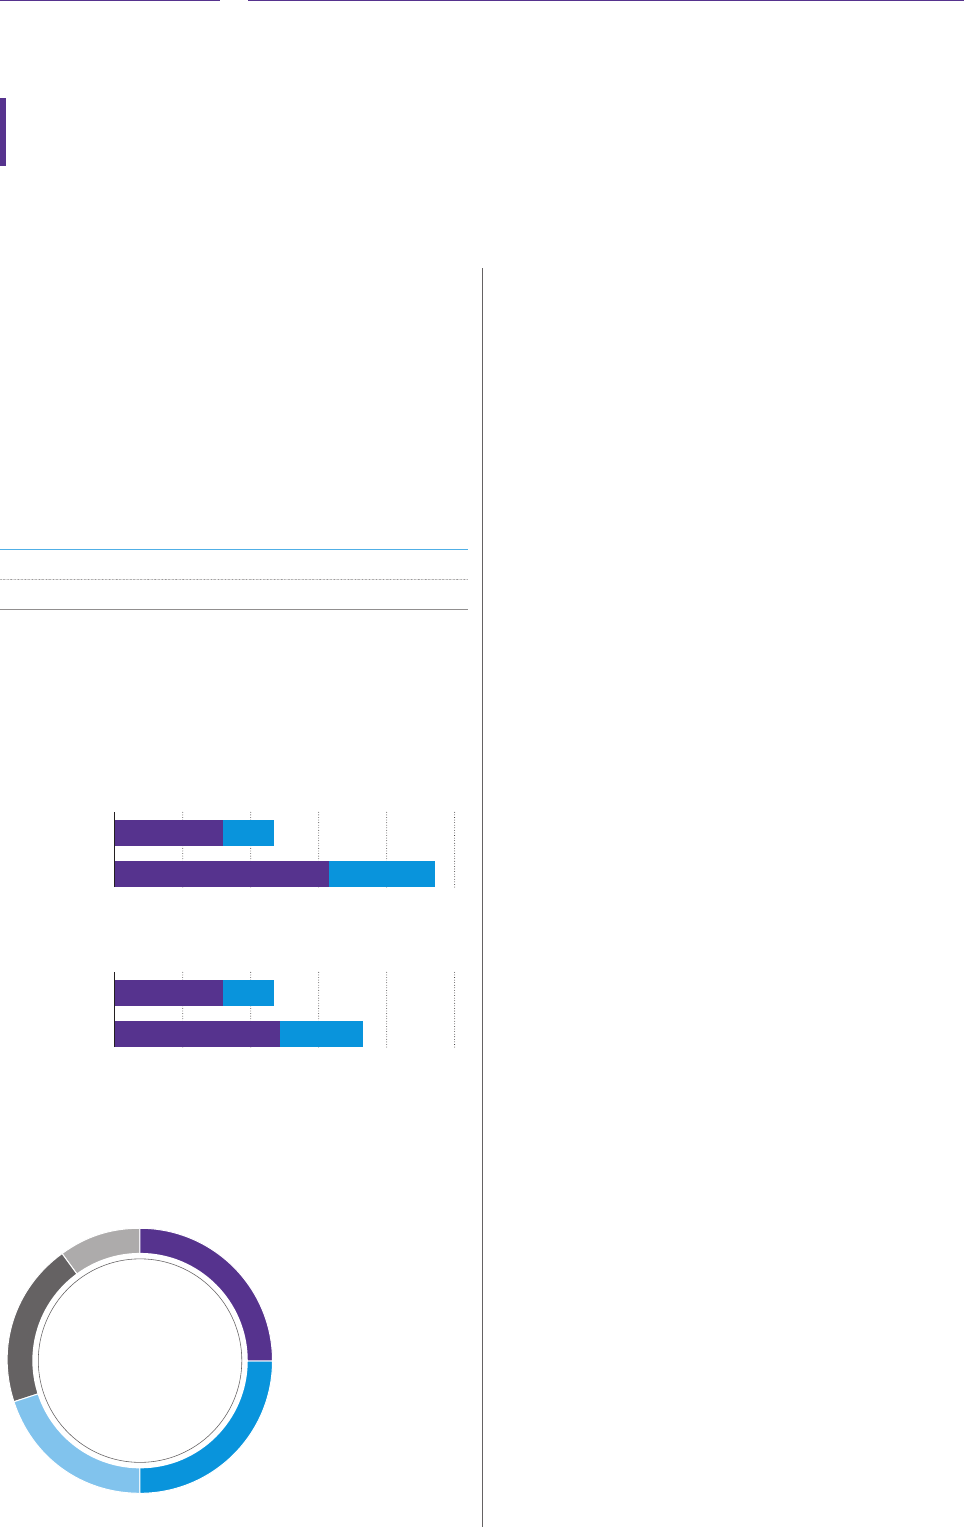
88
BT Group plc Annual Report 2019
Benets
The committee has set benets in line with the Remuneration
Policy. We propose no changes to the benet framework for
2019/20.
Pension
The table below sets out the level of pension provision for 2019/20
for both executive directors. As a new joiner, Philip’s pension
provision is in line with that of the wider management population in
the UK. We will review the pension provision for existing executive
directors in advance of our 2020 Remuneration Policy review.
% of salary
Philip Jansen 15% of salary in lieu of pension provision
Simon Lowth 30% of salary in lieu of pension provision
Annual bonus
The table below describes the level of bonus opportunity (expressed
as a percentage of salary) for Philip Jansen and Simon Lowth in
2019/20. One third of any bonus will be deferred into shares for a
period of three years.
Philip Jansen
Target
Maximum
0%
80%
160% 80%
40%
50 100 150 200
250
Simon Lowth
Target
Maximum
0%
80%
120% 60%
40%
50 100 150 200
250
●
Cash ● Deferred shares
The 2019/20 annual bonus structure and weighting is set
out below.
Chief executive and chief nancial ocer
1. Adjusted earnings per share 25%
2. Normalised free cash flow 25%
3. Customer experience 20%
4. Strategic objectives 20%
5. Revenue (including transit) 10%
1
2
3
4
5
Chief executive and chief financial officer
Adjusted earnings per share, normalised free cash ow, and
revenue (including transit) have a direct impact on shareholder
value. Customer experience (measured through Customer
Perception and Keeping Our Promises) is vital to the company’s
long-term health and growth. All four of these measures are KPIs
for BT and are dened on pages 30 to 31.
We do not publish details of the nancial targets in advance as these
are commercially condential. We will publish achievement against
these targets at the same time as we disclose bonus payments in the
2020 Directors’ Remuneration Report so shareholders can evaluate
performance against those targets.
The strategic objectives are aligned to our strategy and are assessed by
the chairman for the chief executive and by the chief executive for the
chief nancial ocer and each senior executive. Performance against
the strategic objectives element is assessed individually and is based
on achievement against individual objectives, organisational culture
and growth measures.
Incentive share plan
Recognising the need to ensure that our remuneration arrangements
support the delivery of BT’s strategy under Philip’s stewardship, at
the time of going to print the ISP 2019 targets had not been set
by the committee. Full details of the performance measures will be
disclosed in advance of the AGM in July so that shareholders have a
full understanding when voting.
Chairman and non-executive director remuneration
The fees for non-executive directors were reviewed during the year.
The last review of non-executive director fees was in January 2018.
In accordance with the Articles of Association, the chairman and
executive directors conducted the review, and considered the role
and requirements of BT, together with the fees paid to non-executive
directors at companies of a similar size and complexity. Following
the review, it was agreed to increase the basic non-executive fee to
£77,000 per year (from £75,000) from 1 June 2019. Other changes
agreed as part of the review were:
• An increase to £8,000 (from £5,000) for membership of the
Digital Impact & Sustainability Committee
(formerly named the
Committee for Sustainable and Responsible Business
) and an
increase to £14,000 (from £12,000) for the
Digital Impact &
Sustainability Committee
chair
• An increase to £30,000 (from £28,000) for the
Remuneration
Committee
chair
• A fee of £8,000 for membership of the
Investigatory Powers
Governance Committee
• An increase to £5,000 (from £4,000) for the fee paid per trip to
those non-executive directors travelling on an intercontinental
basis to Board and board committee meetings.
These increases reect the responsibilities of the roles and ensures we
remain competitive in the marketplace and are able to recruit directors
with international telecoms experience where required.
Annual remuneration report continued

89
BT Group plc Annual Report 2019 Strategic report
Governance
Financial statements
Additional information
The
BT Pensions
and
Technology Committees
were disbanded on
3 April 2019. See page 67 for further detail.
The table below sets out the fees for membership of, or chairing a
board committee (including the changes agreed during the year):
Committee Chair’s fee Member’s fee
Audit & Risk
£35,000
£25,000
BT Compliance
a
£ 25,000 £12,000
Digital Impact & Sustainability
£14,000 £8,000
Investigatory Powers Governance
n/a
b
£8,000
Nominations
n/a
b
£10,000
Remuneration
£30,000 £15,000
a
A sub-committee of the
Audit & Risk Committee
.
b
Where the chairman or chief executive acts as chair of a board committee, no additional
committee chair fee is payable.
The senior independent director receives an additional fee of £27,000
a year for that position.
No element of non-executive director remuneration is performance-
related. Non-executive directors do not participate in BT’s bonus or
employee share plans and are not members of any of the company
pension schemes.
No review of the chairman’s fee was undertaken. The committee
agreed a ve year xed fee of £700,000 per year, on Jan du Plessis’s
appointment as chairman in November 2017.
Other remuneration matters
Advisers
During the year, the committee received independent advice on
executive remuneration matters from Deloitte LLP. Deloitte received
£204,295 in fees for these services. The fees are charged on a
time-spent basis in delivering advice. That advice materially assisted
the committee in their consideration of matters relating to executive
remuneration.
Deloitte is a founder member of the Remuneration Consultants
Group and as such, voluntarily operates under the code of conduct
in relation to executive remuneration consulting in the UK. The
committee appointed Deloitte to the role of independent advisers
to the committee in 2012 following a competitive tender exercise
conducted by the committee.
The committee is comfortable that the Deloitte engagement partner
and team, who provide remuneration advice to the committee,
have no connections with BT that may impair their independence
or objectivity.
In addition, during 2018/19, Deloitte provided the company with
advice on corporate and indirect taxes, assistance with regulatory,
risk and compliance issues and additional consultancy services.
Dilution
For a number of years we generally used treasury shares to satisfy
the exercise of share options and the vesting of share awards under
our employee share plans. We intend to use both treasury shares and
shares purchased by the BT Group Employee Share Ownership Trust
(the Trust) for share option exercises, and shares purchased by the
Trust for the vesting of executive share awards in 2019/20. Shares
held in the Trust do not have any voting rights.
At the end of 2018/19, shares equivalent to 2.83% (2017/18:
1.76%) of the issued share capital (excluding treasury shares) would
be required for all share options and awards outstanding.
Of these, we estimate that for 2019/20, shares equivalent to
approximately 0.39% (2018/19: 0.28%) of the issued share capital
(excluding treasury shares) will be required for the all-employee
share plans.
Outside appointments
The
Nominations Committee
determines the policy for, considers,
and if thought t agrees the taking up of external directorships and
other external interests by members of the
Executive Committee
, and
other senior direct reports to the chief executive. In accordance with
the new Code for the nancial year 2019/20 onwards, directors must
seek prior approval of the Board before accepting additional external
appointments.
Gavin Patterson is a non-executive director of British Airways for
which he receives an annual fee of £50,000 and the benet of free
BA ights.
Voting at the 2018 Annual General Meeting
The table below sets out the votes cast in respect of the Annual
Remuneration Report at the Annual General Meeting held on
11 July 2018.
Votes cast in
favour % Votes cast against %
Approve Annual
Remuneration
Report 4,419,598,193 65.84 2,292,952,264 34.16
235,781,388 votes were withheld against approving the Annual
Remuneration Report. Withheld votes are not counted when
calculating voting outcomes. We set out details of our response in the
remuneration committee chair's letter on pages 73 to 75.
Committee evaluation 2018/19
We carried out an internal evaluation led by the chairman and
company secretary. This entailed questionnaires completed by
committee members and attendees; the output of which was
discussed and debated by the committee.
Key area of focus Suggested actions
Incentive and reward
structure
• Review the structure of executive
incentives and reward, in the
context of the strategy refresh
and the new chief executive’s
priorities.
Target setting • Ensure that when setting targets
they are appropriately stretching.

90
BT Group plc Annual Report 2019
Independent non-executive directors’ letters of appointment
Each independent non-executive director has an appointment
letter setting out the terms of his or her appointment. They do
not have service contracts. The letter includes membership of any
board committees, the fees to be paid and the time commitment
expected. We ask each non-executive director to allow a minimum
commitment of 22 days each year, subject to committee
responsibilities, and to allow slightly more in the rst year in
order to take part in the induction programme. The actual time
commitment required in any year may vary depending on business.
We make clear that additional time may be required during periods
of increased activity.
Appointments are for an initial period of three years. During that
period, either party can give the other at least three months’ notice
of termination. All Board appointments automatically terminate
in the event of a director not being elected or re-elected by
shareholders at the Annual General Meeting. The appointment of
a non-executive director is terminable on notice by the company
without compensation. At the end of the period, the appointment
may be continued by mutual agreement. The appointment letter
also covers matters such as condentiality, data protection and BT’s
share dealing code.
See below for further details of appointment arrangements for
independent non-executive directors.
Tim Höttges was appointed as a non-independent, non-executive
director in January 2016 following Deutsche Telekom’s nomination,
and his appointment letter reects the terms of the Relationship
Agreement between BT and Deutsche Telekom.
Directors’ service agreements and letters of appointment
The following table sets out the dates on which directors’ service agreements/initial letters of appointment commenced and the current expiry dates:
Chairman and executive directors
Commencement date Expiry date of current service agreement or letter of appointment
Jan du Plessis 1 June 2017 Terminable by the company on 12 months’ notice and by the director on six months’ notice.
Philip Jansen 1 January 2019 Terminable by the company on 12 months’ notice and by the director on six months’ notice.
Simon Lowth 6 July 2016 Terminable by the company on 12 months’ notice and by the director on six months’ notice.
Non-executive directors
Commencement date Expiry date of current service agreement or letter of appointment
Iain Conn 1 June 2014 Letter of appointment was for an initial period of three years. The appointment was extended for a further three
years in May 2017.
Tim Höttges 29 January 2016 Appointed as a non-independent, non-executive director under the terms of the Relationship Agreement between
BT and Deutsche Telekom. The appointment is terminable immediately by either party.
Isabel Hudson 1 November 2014 Letter of appointment was for an initial period of three years. The appointment was extended for a further three
years in October 2017.
Mike Inglis 1 September 2015 Letter of appointment was for an initial period of three years. The appointment was extended for a further three
years in August 2018.
Matthew Key 25 October 2018 Letter of appointment is for an initial period of three years.
Allison Kirkby 15 March 2019 Letter of appointment is for an initial period of three years.
Nick Rose 1 January 2011 Letter of appointment was for an initial period of three years. The appointment was extended for a further three
years in December 2016 following extension in 2013.
Jasmine Whitbread 19 January 2011 Letter of appointment was for an initial period of three years. The appointment was extended for a further three
years in December 2016 following extension in 2013.
There are no other service agreements, letters of appointment or material contracts, existing or proposed, between the company and any
of the directors. There are no arrangements or understandings between any director or executive ocer and any other person pursuant to
which any director or executive ocer was selected to serve. There are no family relationships between the directors.
Inspection by the public
The service agreements and letters of appointment are available for inspection by the public at BT’s registered oce. They will also be
available for inspection commencing one hour prior to the start of our AGM, to be held in London on 10 July 2019.
Nick Rose
Chair of the Remuneration Committee
8 May 2019
Annual remuneration report continued

91
BT Group plc Annual Report 2019 Strategic report
Governance
Financial statements
Additional information
Remuneration policy
The directors’ remuneration policy (the ‘Policy’) which was
approved by shareholders at the AGM on 12 July 2017 in
accordance with section 439A of the Companies Act 2006,
can be found online at bt.com/downloadcentre
Legacy matters
The committee reserves the right to make any remuneration
payments and/or payments for loss of oce (including exercising
any discretions available to it in connection with such payments)
notwithstanding that they are not in line with the Policy where
the terms of the payment were agreed (i) before the AGM in 2014
(the date the company’s rst shareholder-approved directors’
remuneration policy came into eect); (ii) before this Policy came
into eect, provided that the terms of the payment were consistent
with the shareholder-approved directors’ remuneration policy
in force at the time they were agreed; or (iii) at a time when the
relevant individual was not a director of the company and, in the
opinion of the committee, the payment was not in consideration
for the individual becoming a director of the company. For these
purposes “payments” includes the committee satisfying awards
of variable remuneration and, in relation to an award over shares,
the terms of the payment are “agreed” at the time the award is
granted. Any legacy payments would be disclosed in the Annual
Remuneration Report for the relevant year.
Minor amendments
The committee may make minor amendments to the arrangements
for the directors as described in the Policy, for regulatory, exchange
control, tax or administrative purposes, or to take account of a
change in legislation.

92
BT Group plc Annual Report 2019
Directors’ information
Statement of directors’ responsibilities in respect
ofthe annual report and the nancial statements
The directors are responsible for preparing the Annual Report and
the Group and parent company nancial statements in accordance
with applicable law and regulations.
Company law requires the directors to prepare Group and parent
company nancial statements for each nancial year. Under that
law they are required to prepare the Group nancial statements
in accordance with International Financial Reporting Standards as
adopted by the European Union (IFRSs as adopted by the EU) and
applicable law and have elected to prepare the parent company
nancial statements on the same basis.
Under company law the directors must not approve the nancial
statements unless they are satised that they give a true and
fair view of the state of aairs of the Group and parent company
and of their prot or loss for that period. In preparing each of the
Group and parent company nancial statements, the directors are
required to:
• select suitable accounting policies and then apply them
consistently
• make judgements and estimates that are reasonable, relevant
and reliable
• state whether they have been prepared in accordance with IFRSs
as adopted by the EU
• assess the Group and parent company’s ability to continue as
a going concern, disclosing, as applicable, matters related to
goingconcern
• use the going concern basis of accounting unless they either
intend to liquidate the Group or the parent company or to cease
operations, or have no realistic alternative but to do so.
The directors are responsible for keeping adequate accounting
records that are sucient to show and explain the parent
company’s transactions and disclose with reasonable accuracy at
any time the nancial position of the parent company and enable
them to ensure that its nancial statements comply with the
Companies Act 2006 (the 2006 Act). They are responsible for
such internal control as they determine is necessary to enable the
preparation of nancial statements that are free from material
misstatement, whether due to fraud or error, and have general
responsibility for taking such steps as are reasonably open to them
to safeguard the assets of the Group and to prevent and detect
fraud and other irregularities.
Under applicable law and regulations, the directors are also
responsible for preparing a Strategic Report, Directors’ Report,
Directors’ Remuneration Report and Corporate Governance
Statement that complies with that law and those regulations.
The directors are responsible for the maintenance and integrity of
the corporate and nancial information included on the company’s
website. Legislation in the UK governing the preparation and
dissemination of nancial statements may dier from legislation in
other jurisdictions.
Responsibility statement of the directors in respect
of the annual nancial report
We conrm that to the best of our knowledge:
• the nancial statements, prepared in accordance with the
applicable set of accounting standards, give a true and fair view
of the assets, liabilities, nancial position and prot or loss of
the company and the undertakings included in the consolidation
taken as a whole
• the strategic report includes a fair review of the development
and performance of the business and the position of the issuer
and the undertakings included in the consolidation taken as
a whole, together with a description of the principal risks and
uncertainties that they face.
We consider the annual report and accounts, taken as a whole, is
fair, balanced and understandable and provides the information
necessary for shareholders to assess the group’s position and
performance, business model and strategy.
Critical accounting estimates, key judgements
andsignicant accounting policies
Our critical accounting estimates, key judgements and signicant
accounting policies conform with IFRSs, as adopted by the
European Union and IFRSs issued by IASB, and are set out on
pages 120 and 121 of the consolidated nancial statements. The
directors have reviewed these policies and applicable estimation
techniques, and have conrmed they are appropriate for the
preparation of the 2018/19 consolidated nancial statements.
Disclosure of information to auditors
As far as each of the directors is aware, there is no relevant audit
information (as dened by section 418(3) of the 2006 Act) that
hasn’t been disclosed to the auditors. Each of the directors believes
that all steps have been taken that ought to have been taken to
make them aware of any relevant audit information and to establish
that the auditors have been made aware of that information.
Going concern
The Strategic report on pages 1 to 54 includes information on the
group structure, strategy and business model, the performance
of each customer-facing unit, the impact of regulation and
competition, and principal risks and uncertainties. The Group
performance section on pages 34 to 41 includes information
on our group nancial results, nancial outlook, cash ow and
net debt, and balance sheet position. Notes 23, 24, 25 and 27
of the consolidated nancial statements include information on
the group’s investments, cash and cash equivalents, borrowings,
derivatives, nancial risk management objectives, hedging policies
and exposure to interest, foreign exchange, credit, liquidity and
market risks.
In line with IAS 1 ‘Presentation of nancial statements’, and revised
FRC guidance on ‘risk management, internal control and related
nancial and business reporting’, management has taken into
account all available information about the future for a period of
at least, but not limited to, 12 months from the date of approval
of the nancial statements when assessing the group’s ability to
continue as a going concern.

93
BT Group plc Annual Report 2019 Strategic report
Governance
Financial statements
Additional information
The directors carried out a robust assessment of the principal risks
aecting the group, including any that could threaten our business
model, future performance, insolvency or liquidity. Details of those
risks and how we manage and mitigate them are set out in Our
principal risks and uncertainties on pages 46 to 53.
Having assessed the principal risks, the directors considered it
appropriate to adopt the going concern basis of accounting when
preparing the nancial statements. This assessment covers the
period to May 2020, which is consistent with the FRC guidance.
Independent advice
The Board has a procedure that allows directors to seek
independent professional advice at BT’s expense.
All directors also have access to the advice and services of the
company secretary.
Directors’ and ocers’ liability insurance
andindemnity
For some years, BT has bought insurance cover for directors,
ocers and employees in positions of managerial supervision
of BT Group plc and its subsidiaries. This is intended to protect
against defence costs, civil damages and, in some circumstances,
civil nes and penalties following an action brought against
them in their personal capacity. The policy also covers individuals
serving as directors of other companies or of joint ventures, or
on boards of trade associations or charitable organisations at BT’s
request. The insurance protects the directors and ocers directly
in circumstances where, by law, BT cannot provide an indemnity. It
also provides BT, subject to a retention, with cover against the cost
of indemnifying a director or ocer. One layer of insurance is ring-
fenced for the directors of BT Group plc.
As at 8 May 2019, and throughout 2018/19, the company’s
wholly-owned subsidiary, British Telecommunications plc, has
provided an indemnity for a group of people similar to the group
covered by the above insurance. Neither the insurance nor the
indemnity provides cover where the individual is proven to have
acted fraudulently or dishonestly.
Interest of management in certain transactions
During and at the end of 2018/19, none of BT’s directors were
materially interested in any material transaction in relation to the
group’s business. None are materially interested in any currently
proposed material transactions.
As set out below, Tim Höttges is a member of the Board as well as
the CEO of Deutsche Telekom.
Power to authorise conicts
All directors have a duty under the 2006 Act to avoid a situation
in which he or she has, or can have, a direct or indirect interest
that conicts, or possibly may conict, with the interests of the
company. The company’s Articles of Association include provisions
for dealing with directors’ conicts of interest in accordance with
the 2006 Act. The company has procedures in place, which it
follows, to deal with such situations. These require the Board to:
• consider each conict situation separately on its particular facts
• consider the conict situation in conjunction with its other duties
under the 2006 Act
• keep records and board minutes on any authorisations granted
by directors and the scope of any approvals given
• regularly review conict authorisation.
We also have a
Conicted Matters Committee
. Tim Höttges owes
duties to both BT and Deutsche Telekom, and the
Conicted
Matters Committee
helps Tim comply with his duciary duties,
although ultimate responsibility rests with him.

94
BT Group plc Annual Report 2019
General information
US regulation
New York Stock Exchange
As a foreign issuer with American Depositary Shares listed on the
New York Stock Exchange (NYSE), BT is obliged to disclose any
signicant ways in which its corporate governance practices dier
from the corporate governance listing standards of the NYSE.
We have reviewed the NYSE listing standards and believe that our
corporate governance practices are consistent with them, with the
following exceptions which do not meet the strict requirements in
the standards.
The NYSE listing standards state that companies must have a
nominating/corporate governance committee composed entirely
of independent directors and with written terms of reference
which, in addition to identifying individuals qualied to become
board members, develops and recommends to the Board a set of
corporate governance principles applicable to the company.
We have a
Nominations Committee
(see Nominations Committee
chair’s report on pages 66 to 68). The
Nominations Committee’s
terms of reference were amended in 2019 such that it will
not ‘‘develop and recommend to the Board a set of corporate
governance guidelines applicable to the corporation’’. These
duties will be discharged by the Board, in compliance with the
rules and regulations of BT’s home country of England & Wales.
This is, however, a technical non-compliance with the NYSE
listing standards. The
Nominations Committee
is chaired by BT’s
chairman, Jan du Plessis who is not considered independent under
the NYSE listing standards. Tim Höttges, our non-independent,
non-executive director, joined the committee on 1 May 2018. The
Board and the
Nominations Committee
are made up of a majority
of independent non-executive directors.
The US Sarbanes-Oxley Act of 2002 (Sarbanes-Oxley Act), the US
Securities and Exchange Commission (SEC) and the NYSE listing
standards all require companies to comply with certain provisions
relating to their audit committee. These include the independence
of audit committee members and procedures for the treatment of
complaints regarding accounting or auditing matters. We comply
fully with these requirements.
US Sarbanes-Oxley Act of 2002
BT has securities registered with the SEC. As a result, we must
comply with those provisions of the Sarbanes-Oxley Act which
apply to foreign issuers. We comply with the legal and regulatory
requirements introduced under the Sarbanes-Oxley Act, in so far as
they apply.
The
Audit & Risk Committee
includes Nick Rose, Allison Kirkby
and Matthew Key who, in the opinion of the Board, are ‘audit
committee nancial experts’ and are independent (as dened for
this purpose). The Board considers that the committee’s members
have broad commercial knowledge and extensive business
leadership experience, having held between them various prior
roles in major business, nancial management, and nancial
function supervision and that this constitutes a broad and suitable
mix of business and nancial experience on the committee.
The code of ethics we have adopted for the purposes of the
Sarbanes-Oxley Act applies to the chief executive, chief nancial
ocer and senior nance managers.
Controls and procedures
Prior year material weakness
Background to the prior year material weakness in relation to
the calculation of our IAS19 accounting valuation of retirement
benet obligations
In July 2018, we announced that we had been alerted to an
error made by our independent external actuary in the actuary’s
calculation of our IAS 19 accounting valuation of retirement
benet obligations at 31 March 2018. Our independent external
actuary is employed as an expert to calculate the IAS 19 accounting
valuation on behalf of management. The error resulted from the
incorrect application of changes to demographic assumptions and
led to an increase in our net pension decit of £0.4bn at 31 March
2018. Management determined that the error was material with
respect to our group statement of comprehensive income and
required the group to restate its previously issued consolidated
nancial statements for the year ended 31 March 2018. The
group restated its comparative balance sheet and statement of
comprehensive income in the next published nancial report at
Q2 2018/19. The restated gures can also be found on page 119.
Also, in accordance with US nancial reporting requirements, we
led restated nancial statements as amendment 2 to our Form
20-F for the year ended 31 March 2018 on 20 September 2018.
We reassessed the eectiveness of the company’s internal control
over nancial reporting as of 31 March 2018 following the
identication of this error. A material weakness is a deciency, or
a combination of deciencies, in internal control over nancial
reporting, such that there is a reasonable possibility that a material
misstatement of our consolidated nancial statements will not be
prevented or detected on a timely basis.
Management determined that, whilst there was a failure in the
operation of controls at our independent external actuary (acting
on behalf of management as an expert), our monitoring control did
not identify the failure.
This monitoring control failure resulted in a material misstatement
of the account balances and disclosures relating to our retirement
benet obligations in our annual consolidated nancial statements
that was not prevented or detected. Accordingly, management
determined that this control deciency constituted a material
weakness which was reported in the amendment 2 to our 20-F for
the year ended 31 March 2018.
Remediation of material weakness in relation to the calculation of
our IAS19 accounting valuation of retirement benet obligations
During the year, management has undertaken a number of actions
to strengthen our internal control over our oversight procedures
in respect of this and have enhanced controls in operation as of
31 March 2019, which will continue to operate going forwards.
Specically:
• obtaining independent conrmation of the operation of controls
within our independent external actuary

95
BT Group plc Annual Report 2019 Strategic report
Governance
Financial statements
Additional information
• increased provision of documentation from our independent
external actuary to allow us to verify changes to data and
demographic assumptions
• the certication to us of independent checks of changes to
non-nancial assumptions performed within our independent
external actuary
• utilising this additional information to enhance and remediate
our monitoring control.
These enhanced controls operated as of 31 March 2019 and
management has concluded the previously reported material
weakness has been appropriately remediated.
Management’s report on internal control over nancial reporting
as of 31 March 2019
Management is responsible for establishing and maintaining
adequate internal control over nancial reporting for the group.
Internal control over nancial reporting is designed to provide
reasonable assurance regarding the reliability of nancial reporting
and the preparation of consolidated nancial statements for
external reporting purposes in accordance with IFRS as issued by
the IASB and IFRS as adopted by the EU.
Because of its inherent limitations, internal control over nancial
reporting may not prevent or detect misstatements. Therefore
even those systems determined to be eective can provide
only reasonable assurance with respect to nancial statement
preparation and presentation. Also, projections of any evaluation of
eectiveness to future periods are subject to the risk that controls
may become inadequate because of changes in conditions, or that
the degree of compliance with the policies or procedures may
deteriorate.
Management conducted an assessment of the eectiveness of
our internal control over nancial reporting as of 31 March 2019
based on the criteria established in “Internal Control – Integrated
Framework” (2013) issued by the Committee of Sponsoring
Organizations of the Treadway Commission (COSO).
While we are satised that we have remediated the material
weakness reported in 2018 in respect of our IAS19 accounting
valuation of retirement benet obligations, described above,
management has concluded that our internal control over nancial
reporting was not eective as of 31 March 2019 due to the
material weaknesses in relation to IT General Controls and Risk
Assessment, described below.
In 2018/19 management undertook a continuous improvement
and enhancement programme in relation to its framework of
internal control over nancial reporting. This programme identied
two areas requiring remediation, specically, IT General Controls
and Risk Assessment.
Although this did not result in any identied misstatements in
the current period consolidated nancial statements, nor in any
restatements of consolidated nancial statements previously
reported by the company, and there are no changes to previously
released nancial results as a result of these matters, it created a
reasonable possibility that a material misstatement would not have
been prevented or detected on a timely basis during the year ended
31 March 2019.
While management has commenced the implementation of
its remediation plans, these material weaknesses existed as of
31March 2019.
Material weaknesses in IT General Controls and Risk Assessment
Background to IT General Controls
We did not design and maintain eective controls over certain
information systems that are relevant to the preparation of
our consolidated nancial statements, principally including the
following deciencies:
• During the year, additional IT applications were brought into
the scope of management’s framework of internal control over
nancial reporting. These additional IT applications were not
identied for inclusion in the scope of management’s framework
of internal control over nancial reporting by our risk assessment
procedures with sucient time to allow the IT General
Controls supporting these additional applications to operate in
accordance with COSO 2013.
• Within EE, SAP privileged user access was granted for short
periods of time during the year ended 31 March 2019 related
to development activity but logs of activity free from potential
manipulation by these users were not retained and changes
implemented by privileged users were not directly monitored.
• While management have a process in place to approve changes
to IT dependent business process controls, this process did not
ensure that all changes during the year ended 31 March 2019
received an appropriate level of approval testing.
Other deciencies that management has identied in relation to
IT General Controls include: the strength of passwords in legacy
systems and an inappropriate policy related to the timely removal
of application access for leavers.
Although these control deciencies did not result in a misstatement
in our consolidated nancial statements the pervasive nature of
these IT General Control deciencies across our signicant classes
of transactions, including the consequential potential impact on
automated controls and dependent manual business controls, has
led management to conclude that a reasonable possibility of a
material misstatement related to these IT General Controls existed
as of 31 March 2019. While remediation activities related to the
above IT General Control deciencies commenced during the year
ended 31 March 2019, management concluded that these were
not fully remediated as of 31 March 2019.
Background to Risk Assessment
Secondly, we identied aspects of our risk assessment processes
requiring remediation. Specically:
• Management have not appropriately addressed the risks of
material misstatement associated with certain outsourced
service organisations, including pension asset valuation services
and a signicant IT outsourced provider.
• Exceptions were noted during our enhancement programme
and subsequent management testing that indicated that
certain ‘Information Produced by the Entity’ (being information
presented in reports used in the operation of a control) was
not itself subject to sucient controls to ensure that such
information was complete and accurate.

96
BT Group plc Annual Report 2019
• Additionally, we identied sub-processes with inadequate
identication and linkage between risk points and their related
controls including management review controls.
Although these control deciencies did not result in a misstatement
in our consolidated nancial statements, as a result of the
potentially pervasive impact of these deciencies on our nancial
statement accounts, we have concluded that there is a reasonable
possibility of material misstatements arising. While remediation
activities related to the above issues commenced during the year
ended 31 March 2019, management concluded that these issues
were not remediated as of 31 March 2019.
Audit of the eectiveness of internal control over
nancialreporting
Our independent registered public accounting rm, KPMG LLP,
who audited the consolidated nancial statements included within
the Form 20-F, has expressed an adverse report on the design
and operating eectiveness of our internal control over nancial
reporting, as stated in their report as of 31 March 2019, which is
included within the Form 20-F.
Changes in internal control over nancial reporting
Changes in our internal control over nancial reporting that
occurred during 2018/19, which have materially aected, or are
reasonably likely to materially aect, our internal control over
nancial reporting are described above under Remediation of
material weakness in relation to the calculation of our IAS19
accounting valuation of retirement benet obligations, on
page94, and in relation to the material weaknesses described
under Material weaknesses in IT General Controls and Risk
Assessment and related remediation thereof as described therein.
To the extent not yet implemented, other changes described
under
Remediation of IT General Controls
and
Remediation of
Risk Assessment
are expected to impact our internal control over
nancial reporting during 2019/2020.
Disclosure controls and procedures
We maintain disclosure controls and procedures that are designed
to ensure that information required to be disclosed in our reports
under the Securities Exchange Act of 1934 (Exchange Act), and
the rules and regulations thereunder, is recorded, processed,
summarised and reported within the time periods specied in the
SEC’s rules and forms and that such information is accumulated and
communicated to our management, including our chief executive
and chief nancial ocer to allow for timely decisions regarding
required disclosure. In designing and evaluating the disclosure
controls and procedures, management recognises that any controls
and procedures, no matter how well designed and operated, can
provide only reasonable assurance of achieving their objectives
and management necessarily applies its judgement and makes
assumptions about the likelihood of future events. There can be no
assurance that any design will succeed in achieving its stated goals
under all potential future conditions, regardless of how remote.
We have evaluated the eectiveness of our disclosure controls and
procedures. Based upon that evaluation, our chief executive and
chief nancial ocer concluded that, as a result of the material
weaknesses in relation to IT General Controls and Risk Assessment
described above, as of 31 March 2019, our disclosure controls
and procedures were not eective to provide reasonable assurance
that information required to be disclosed by us in the reports that
we le or furnish under the Exchange Act is recorded, processed,
summarised and reported, within the time periods specied in the
applicable rules and forms.
Remediation of the Material weaknesses in IT General Controls
and Risk Assessment
Remediation of IT General Controls
A programme has been operating since the beginning of the fourth
quarter of 2018/19 to implement controls over the additionally
identied applications to the required standard. We have detailed
remediation plans for the other specic items identied which we
intend to complete in our nancial year 2019/20.
Remediation of Risk Assessment
A programme has been operating since the beginning of the
fourth quarter of 2018/19 to document the mapping of risks in
outsourced service organisations, to support the identication and
testing of the completeness and accuracy of certain Information
Produced by the Entity and to continue to document the
identication and linkage between risk points and their related
controls. It is intended that this will be completed in our nancial
year 2019/20.
UK internal control and risk management
The Board is responsible for the group’s systems of internal control,
risk management and assurance and for reviewing the eectiveness
of those systems each year. These systems are designed to manage,
rather than eliminate, risks we face that may prevent us achieving
our business objectives; any system can provide only reasonable,
and not absolute, assurance against material misstatement or loss.
For details of our assessment of our internal controls for the
purposes of the Sarbanes-Oxley Act, see US Regulation on
page 94. The Board also takes account of signicant social,
environmental and ethical matters that relate to BT’s businesses,
and reviews BT’s corporate responsibility policy every year. We
describe our workplace practices, specic environmental, social
and ethical risks and opportunities, and details of underlying
governance processes on pages 1 to 54 in the Strategic report.
We have enterprise-wide risk management processes for
identifying, evaluating and managing the principal risks faced by
the group. These processes have been in place throughout the year
and have continued up to the date on which this document was
approved. The processes are in accordance with the FRC guidance
on risk management, internal control and related nancial and
business reporting.
Risk assessment and evaluation are an integral part of BT’s annual
strategic review cycle. We have a detailed risk management process
which identies the key risks facing the group, our customer-facing
units and Technology.
The key features of our enterprise-wide risk management and
internal control process (covering nancial, operational and
compliance controls) are as follows:
• senior executives collectively review the group’s key risks, and
have created a Group Risk Register describing the risks, their
owners and associated mitigation strategies. The
Group Risk
General information continued

97
BT Group plc Annual Report 2019 Strategic report
Governance
Financial statements
Additional information
Panel
and the
Executive Committee
reviews this before it’s
reviewed and approved by the Board
• our customer-facing units and Technology carry out risk
assessments of their operations, create risk registers relating to
those operations and ensure that the key risks are addressed
• senior executives with responsibility for major group operations
report quarterly on their opinion on the eectiveness of the
operation of internal controls in their areas of responsibility
• the group’s internal auditors carry out ongoing assessments
of the quality of risk management and control, report to
management and the
Audit & Risk Committee
on the status of
specic areas identied for improvement, and promote eective
risk management in customer-facing units and Technology
• the
Audit & Risk Committee
, on behalf of the Board, considers
the eectiveness of the group’s internal control procedures
during the nancial year. It reviews reports from the internal
and external auditors, and reports its conclusions to the Board.
The
Audit & Risk Committee
has carried out these actions for
2018/19
• the
Audit & Risk Committee
, on behalf of the Board, reviews
the eectiveness of risk management arrangements across the
group. In support of this, the chief executive and the CEOs of
each customer-facing unit and Technology or their delegates
hold an annual review meeting.
We have not included joint ventures and associates, which BT does
not control, as part of the group risk management process. Third
parties we enter into joint ventures with are responsible for their
own internal control assessment.
We have set out our signicant accounting policies on pages 120 to
121. The consistent application of those policies is subject to on-
going verication through management review and independent
review by internal and external auditors.
The processes supporting the preparation and consolidation of the
nancial statements have been documented and are subject to
annual verication through the programme of testing completed
by our internal auditors. This serves to conrm the operation of
internal controls over nancial reporting, as well as compliance
with the Sarbanes-Oxley Act. The
Audit & Risk Committee
reviews
BT’s published nancial results, related disclosures and accounting
judgements. The committee’s activities for 2018/19 are set out on
pages 69 to 72.
Capital management and funding policy
The objective of our capital management policy is to target an
overall level of debt consistent with our credit rating objectives,
while investing in the business, supporting the pension fund and
paying dividends.
The Board reviews the group’s capital structure regularly.
Management proposes actions which reect the group’s investment
plans and risk characteristics, as well as the macro-economic
conditions in which we operate.
Our funding policy is to raise and invest funds centrally to meet the
group’s anticipated requirements. We use a combination of capital
market bond issuance, commercial paper borrowing and committed
borrowing facilities to fund the group. When issuing debt, in order
to avoid renancing risk, group treasury will take into consideration
the maturity prole of the group’s debt portfolio as well as forecast
cash ows.
See note 27 to the consolidated nancial statements for details of
our treasury policy.
Financial instruments
Details of the group’s nancial risk management objectives, policies
of the group and exposure to interest risk, credit risk, liquidity risk
and foreign exchange are given in note 27 to the consolidated
nancial statements.
Credit risk management policy
We take proactive steps to minimise the impact of adverse market
conditions on our nancial instruments. In managing investments
and derivative nancial instruments, the group’s central treasury
function monitors the credit quality across treasury counterparties
and actively manages any exposures that arise. Management within
the business units also actively monitors any exposures arising from
trading balances.
O-balance sheet arrangements
Other than the nancial commitments and contingent liabilities
disclosed in note 30 to the consolidated nancial statements,
there are no o-balance sheet arrangements that have, or are
reasonably likely to have, a current or future material eect on:
• our nancial condition
• changes in nancial condition
• revenues or expenses
• results of operations
• liquidity
• capital expenditure
• capital resources.
Legal proceedings
The group is involved in various legal proceedings, including
actual or threatened litigation and government or regulatory
investigations. For further details of legal and regulatory
proceedings to which the group is party please see note 30 to the
consolidated nancial statements on pages 171 to 172.
Apart from the information disclosed in note 30 to the consolidated
nancial statements, the group does not currently believe
that there are any legal proceedings, government or regulatory
investigations that may have a material adverse impact on the
operations or nancial condition of the group. In respect of each
of the claims described in note 30, the nature and progression of
such proceedings and investigations can make it dicult to predict
the impact they will have on the group. Many factors prevent us
from making these assessments with certainty, including that the
proceedings or investigations are in early stages, no damages or
remedies have been specied, and/or the frequently slow pace of
litigation.

98
BT Group plc Annual Report 2019
Other information - Listing Rules
For the purposes of LR 9.8.4CR, the information required to be
disclosed by LR 9.8.4R is on the following pages:
Section Information Page
(1) Interest capitalised Not material
for the group
(2) Publication of unaudited financial information Not applicable
(4) Details of unusual long-term incentive schemes 86
(5) Waiver of emoluments by a director Not applicable
(6) Waiver of future emoluments by a director Not applicable
(7) Non pre-emptive issues of equity for cash Not applicable
(8) Non pre-emptive issue by a major subsidiary
undertaking
Not applicable
(9) Parent participation in a placing by
a listed subsidiary
Not applicable
(10) Contracts of significance involving a director or
controlling shareholder
Not applicable
(11) Provision of services by a controlling shareholder Not applicable
(12) Shareholder waiver of dividends See below
(13) Shareholder waiver of future dividends See below
(14) Agreements with controlling shareholders Not applicable
In respect of LR 9.8.4R (12) and (13), the Trustee of the BT Group
Employee Share Ownership Trust agrees to waive dividends payable
on the BT shares it holds for satisfying awards under various BT
executive share plans. Under the rules of these share plans, the
dividends are reinvested in BT shares that are added to the relevant
share awards.
Other statutory information – Companies Act 2006
Certain provisions of the 2006 Act require us to make additional
disclosures. These are described on the pages listed below:
Information Page
Structure of BT’s share capital (including the rights
and obligations attaching to the shares)
113 and
98 to 99
Restrictions on the transfer of BT shares
and voting rights
98 to 99
Signicant direct or indirect shareholdings 65
Appointment and replacement of directors 63, 90 and
98
Signicant agreements to which BT Group plc is a
party that take eect, alter or terminate upon a
change of control following a takeover
Not
applicable
Branches 177 to 184
The following disclosures are not covered elsewhere in this Annual
Report:
• BT has two employee share ownership trusts that hold BT shares
for satisfying awards under our various employee share plans.
The Trustee of the BT Group Employee Share Investment Plan
may invite participants, on whose behalf it holds shares, to direct
it how to vote in respect of those shares. If there is an oer for
the shares or other transaction that would lead to a change of
control of BT, participants may direct the Trustee to accept the
oer or agree to the transaction. In respect of shares held in the
BT Group Employee Share Ownership Trust, the Trustee abstains
from voting those shares
• if there is an oer for the shares, the Trustee does not have to
accept or reject the oer but will have regard to the interests of
the participants, may consult them to obtain their views on the
oer, and may otherwise take any action with respect to the oer
it thinks fair
• no person holds securities carrying special rights with regard to
control of the company
• the registrars must receive proxy appointment and voting
instructions not less than 48 hours before a general meeting (see
also pages 98 and 99)
• any amendment of BT’s Articles of Association requires
shareholder approval in accordance with applicable legislation
• the powers of BT directors are determined by UK legislation and
the Articles of Association. The directors are authorised to issue
and allot shares, and to undertake purchases of BT shares subject
to shareholder approval at the AGM
• we have no agreements with directors providing for
compensation for loss of oce or employment as a result of a
takeover. Similarly, there is no provision for this in our standard
employee contracts
• we are not aware of any agreements between shareholders
thatmay result in restrictions on the transfer of shares or on
voting rights.
Articles of Association
The company’s current Articles of Association were adopted
pursuant to a resolution passed at the Annual General Meeting of
the company held on 15 July 2015 and contain, amongst others,
provisions on the rights and obligations attaching to the company’s
shares. The Articles of Association may only be amended by special
resolution at a general meeting of the shareholders.
Directors’ appointment and retirement
The company’s Articles of Association regulate the appointment
and removal of directors, as does the 2006 Act and related
legislation. The Board and shareholders (by ordinary resolution)
may appoint a person who is willing to be elected as a director,
either to ll a vacancy or as an additional director. At every annual
general meeting, all directors must automatically retire. A retiring
director is eligible for re-election. In addition to any power of
removal under the 2006 Act, the shareholders can pass an ordinary
resolution to remove a director.
Share rights
(a) Voting rights
Subject to the restrictions described below, on a show of hands,
every shareholder present in person or by proxy at any general
meeting has one vote and, on a poll, every shareholder present in
person or by proxy has one vote for each share which they hold.
Voting at any meeting of shareholders is by a show of hands unless
General information continued

99
BT Group plc Annual Report 2019 Strategic report
Governance
Financial statements
Additional information
a poll is demanded by the chairman of the meeting or by at least
ve shareholders at the meeting who are entitled to vote (or their
proxies), or by one or more shareholders at the meeting who are
entitled to vote (or their proxies) and who have, between them, at
least 10% of the total votes of all shareholders who have the right
to vote at the meeting.
No person is, unless the Board decides otherwise, entitled to
attend or vote at any general meeting or to exercise any other right
conferred by being a shareholder if they or any person appearing to
be interested in those shares has been sent a notice under section
793 of the 2006 Act (which confers upon public companies the
power to require information with respect to interests in their
voting shares) and they or any interested person has failed to
supply the company the information requested within 14 days
after delivery of that notice. These restrictions end seven days after
the earlier of the date the shareholder complies with the request
satisfactorily or the company receives notice that there has been an
approved transfer of the shares.
(b) Variation of rights
Whenever the share capital of the company is split into dierent
classes of shares, the special rights attached to any of those classes
can be varied or withdrawn either: (i) with the sanction of a special
resolution passed at a separate meeting of the holders of the shares
of that class; or (ii) with the consent in writing of the holders of at
least 75% in nominal value of the issued shares of that class. The
company can issue new shares and attach any rights and restrictions
to them, as long as this is not restricted by special rights previously
given to holders of any existing shares. Subject to this, the rights
of new shares can take priority over the rights of existing shares, or
existing shares can take priority over them, or the new shares and
the existing shares can rank equally.
(c) Changes in capital
The company may by ordinary resolution: (i) divide all or any of
its share capital into shares with a smaller nominal value; and (ii)
consolidate and divide all or part of its share capital into shares of
a larger nominal value. The company may also: (i) buy back its own
shares; and (ii) by special resolution reduce its share capital, any
capital redemption reserve and any share premium account.
Transfer of shares
Certicated shares of the company may be transferred in writing
either by an instrument of transfer in the usual standard form or
in another form approved by the Board. The transfer form must
be signed or made eective by or on behalf of the person making
the transfer. The person making the transfer will be treated as
continuing to be the holder of the shares transferred until the name
of the person to whom the shares are being transferred is entered in
the register of members of the company. The Board may refuse to
register any transfer of any share held in certicated form: (i) which
is in favour of more than four joint holders; or (ii) unless the transfer
form to be registered is properly stamped to show payment of any
applicable stamp duty and delivered to the company’s registered
oce or any other place the Board decide. The transfer must have
with it: any other evidence which the Board asks for to prove that
the person wanting to make the transfer is entitled to do this; and
if the transfer form is executed by another person on behalf of the
person making the transfer, evidence of the authority of that person
to do so. Transfers of uncerticated shares must be carried out
using a relevant system (as dened in the Uncerticated Securities
Regulations 2001 (the Regulations)). The Board can refuse to
register a transfer of an uncerticated share in the circumstances
stated in the Regulations. If the Board decides not to register a
transfer of a share, the Board must notify the person to whom that
share was to be transferred giving reasons for its decision. This must
be done as soon as possible and no later than two months after the
company receives the transfer or instruction from the operator of
the relevant system.
Political donations
Our policy is that no company in the group will make contributions
in cash or in kind to any political party, whether by gift or loan.
However, the denition of political donations used in the 2006
Act is very much broader than the sense in which these words are
ordinarily used. For example, it could cover making members of
parliament and others in the political world aware of key industry
issues and matters aecting the company, enhancing their
understanding of BT.
The authority for political donations requested at the AGM is not
intended to change this policy. It will, however, ensure that the
group continues to act within the provisions of the 2006 Act
requiring companies to obtain shareholder authority before they
make donations to EU political parties and/or political organisations
as dened in the 2006 Act. During 2018/19, the company’s wholly
owned subsidiary, British Telecommunications plc, paid the costs of
attending corporate days of (i) the Conservative party conference;
(ii) the Labour party conference; and (iii) the Scottish National party
conference. These costs totalled £4,616 (2017/18: £3,829). No
company in the BTGroup made any loans to any political party.
Cross reference to the Strategic report
In line with the 2006 Act, we have chosen to include the following
information in the Strategic report (required by law to be included
in the Report of the Directors):
• The nal dividend proposed by the Board (page 13)
• An indication of likely future developments in the business of the
company (see the Strategic report on pages 1 to 54)
• An indication of our R&D activities (pages 12 and 19)
• Information about our people (pages 22 to 24)
• Information about greenhouse gas emissions (pages 26 and 27).
By order of the Board
Rachel Canham
Company Secretary & General Counsel, Governance
8 May 2019

Financial statements
Independent auditors’ report 101
Group income statement 110
Group statement of comprehensive income 111
Group balance sheet 112
Group statement of changes in equity 113
Group cash ow statement 114
Notes to the consolidated nancial statements
Basis of preparation 115
Prior year restatement and opening balance adjustments 119
Critical accounting estimates and key judgements 120
Signicant accounting policies that apply
to the overall nancial statements 121
Segment information 122
Revenue 125
Operating costs 128
Employees 129
Audit, audit related and other non-audit services 130
Specic items 130
Taxation 132
Earnings per share 135
Dividends 135
Intangible assets 136
Property, plant and equipment 138
Programme rights 141
Trade and other receivables 141
Trade and other payables 143
Provisions 143
Retirement benet plans 145
Own shares 155
Share-based payments 155
Investments 157
Cash and cash equivalents 159
Loans and other borrowings 159
Finance expense 163
Financial instruments and risk management 163
Other reserves 170
Related party transactions 171
Financial commitments and contingent liabilities 171
Financial statements of BT Group plc 173
Related undertakings 177
Additional information 185
Detailed analysis of our statutory accounts,
independently audited and providing in-depth
disclosure on the nancial performance
and position of the group.
100
BT Group plc Annual Report 2019

101
BT Group plc Annual Report 2019 Strategic report
Governance
Financial statements
Additional information
1 Our opinion is unmodied
We have audited the nancial statements of BT Group plc (“the Company”) for the year ended 31 March 2019 which comprise the group
income statement, the group statement of comprehensive income, group balance sheet, group statement of changes in equity, group cash
ow statement, company balance sheet, company statement of changes in equity, and the related notes, including the accounting policies
in note 1.
In our opinion:
• the nancial statements give a true and fair view of the state of the Group’s and of the parent Company’s aairs as at 31 March 2019
and of the Group’s prot for the year then ended;
• the Group nancial statements have been properly prepared in accordance with International Financial Reporting Standards as
adopted by the European Union (IFRSs as adopted by the EU);
• the parent Company nancial statements have been properly prepared in accordance with UK accounting standards, including FRS 101
Reduced Disclosure Framework
; and
• the nancial statements have been prepared in accordance with the requirements of the Companies Act 2006 and, as regards the
Group nancial statements, Article 4 of the IAS Regulation.
Additional opinion in relation to IFRSs as issued by the IASB
As explained in the note to the Group nancial statements, the Group, in addition to complying with its legal obligation to apply IFRSs as
adopted by the EU, has also applied IFRSs as issued by the International Accounting Standards Board (IASB).
In our opinion, the Group nancial statements have been properly prepared in accordance with IFRSs as issued by the IASB.
Basis for opinion
We conducted our audit in accordance with International Standards on Auditing (UK) (“ISAs (UK)”) and applicable law. Our responsibilities
are described below. We believe that the audit evidence we have obtained is a sucient and appropriate basis for our opinion. Our audit
opinion is consistent with our report to the audit committee.
We were rst appointed as auditor by the shareholders on 11 July 2018. The nancial year ended 31 March 2019 is our rst year as
auditor. We have fullled our ethical responsibilities under, and we remain independent of the Group in accordance with, UK ethical
requirements including the FRC Ethical Standard as applied to listed public interest entities. No non-audit services prohibited by that
standard were provided.
Overview
Materiality: Group nancial statements as a whole
£115m
4.3% of prot before tax
Coverage
97% group prot before tax
Key audit matters
• Valuation of pension scheme obligation and unquoted investments in the BT Pension Scheme (BTPS)
• Long term customer contracts in Global Services and Enterprise
• Adequacy of regulatory and litigation provisions
• Useful economic lives assigned to internally generated intangible assets
• Accuracy of revenue due to the complexity of the billing systems
• Recoverability of parent company’s investment in subsidiary and debt due from group undertakings
2 Key audit matters: our assessment of risks of material misstatement
Key audit matters are those matters that, in our professional judgement, were of most signicance in the audit of the nancial statements
and include the most signicant assessed risks of material misstatement (whether or not due to fraud) identied by us, including those
which had the greatest eect on: the overall audit strategy; the allocation of resources in the audit; and directing the eorts of the
engagement team. We summarise below the key audit matters, in decreasing order of audit signicance, in arriving at our audit opinion
above, together with our key audit procedures to address those matters and, as required for public interest entities, our results from those
procedures. These matters were addressed, and our results are based on procedures undertaken, in the context of, and solely for the
purpose of, our audit of the nancial statements as a whole, and in forming our opinion thereon, and consequently are incidental to that
opinion, and we do not provide a separate opinion on these matters.
Independent auditors’ report
to the members of BT Group plc
Report on the audit of the nancial statements

Independent auditors’ report to the members of BT Group plc continued
Report on the audit of the nancial statements continued
102
BT Group plc Annual Report 2019
Valuation of pension scheme obligation and unquoted investments in the BT Pension Scheme (BTPS)
BTPS obligation £58.9 billion
Refer to page 69 Audit & Risk Committee Report, page 145 note 20 accounting policy Retirement benets and page 145 nancial
disclosures note 20 Retirement benet plans.
The risk
Subjective estimate:
Small changes in the assumptions used to value the BTPS obligation, in particular those relating to ination, mortality and discount rates,
can have a signicant impact on the BTPS net pension decit.
The BTPS holds plan assets for which quoted prices are not available. Signicant judgement is required in determining the value of these
level 3 assets, which together represented 17% (£9.0 billion) of the total pension scheme assets held. The plan asset categories which
require signicant judgement include property, private equity, infrastructure and the longevity insurance contract.
The eect of these matters is a potential range of reasonable outcomes greater than our materiality for the nancial statements as a
whole. The nancial statements (note 20) disclose the sensitivity of key assumptions for the obligation estimated by the Group and the
uncertainties associated with the valuation of level 3 plan assets.
Our response
For the pension scheme obligation our procedures included:
• Control design and operation: Evaluating the processes and controls over the assumptions of the BTPS obligation.
• Benchmarking assumptions: Challenging, with the support of our own actuarial specialists, the key assumptions, being the ination,
mortality and discount rate, applied to derive the pension obligation against both internally and externally derived data.
For the level 3 plan assets our procedures included:
• Control design and operation: Evaluating the processes and controls over the valuation of the BTPS level 3 plan assets.
Our testing identied weaknesses in the design of these controls. As a result we expanded the extent of our detailed testing over and
above that originally planned.
Property/Infrastructure:
• Assessing valuer’s credentials: Evaluating the competence, capabilities and objectivity of the directors’ experts engaged to
independently value the property and infrastructure investments.
• Benchmarking assumptions: Engaging our own valuation specialist to review the 3rd party valuation reports, including benchmarking
assumptions against externally derived indices, comparable assets and market practice with focus on those which are highly sensitive in
deriving fair value. Challenging 3rd party valuation experts, through direct discussions, on the valuation methodology and key
assumptions applied, using the benchmarking noted above (property only).
• Expectation vs outcome: Performing trend analysis on key data inputs used by the 3rd party experts in determining the valuation.
(infrastructure only).
• Test of details: Agreeing key inputs in the 3rd party valuations to a sample of property lease agreements (property only).
Private Equity:
• Assessing valuer’s credentials: Evaluating the competence, capabilities and objectivity of the fund managers responsible for
overseeing the private equity funds.
• Evaluating the control environment of the funds by obtaining and analysing independently issued controls reports.
• Test of details: Obtaining third party investment manager conrmations, reading the latest audited nancial statements for the
private equity funds and assessing the historical accuracy of previous valuations.
Longevity insurance contract:
• Methodology choice: Engaging our own valuation specialist to critically assess the valuation methodology with respect to the
Statement of Recommended Practice principals for longevity swap valuations.
• Benchmarking assumptions: Engaging our own valuation specialist to compare mortality, discount rate and market premium rate
assumptions against internally and externally derived data and producing a valuation range against which we compare the proposed
longevity insurance contract valuation. Challenging 3rd party valuation experts, through direct discussions, on the valuation
methodology and key assumptions applied using the benchmarking noted above.

103
BT Group plc Annual Report 2019 Strategic report
Governance
Financial statements
Additional information
For both pension scheme obligation and level 3 plan assets our procedures included:
• Assessing transparency: Considering the adequacy of the Group’s disclosures in respect of the sensitivity of the decit to these
assumptions. Considering the adequacy the Group’s disclosures in respect of the uncertainties associated with the valuation of
level 3 plan assets.
Our results
We consider the valuation of the BTPS obligation and unquoted investments to be acceptable.
Long-term customer contracts in Global Services and Enterprise
Refer to page 69 (
Audit & Risk Committee
Report), page 125 nancial disclosures note 6 Revenue, page 141 nancial disclosures note 17
Trade and other receivables and page 143 nancial disclosures note 19 Provisions.
The risk
Subjective estimate:
The Global Services and Enterprise customer-facing units enter into long-term customer contracts, including major contracts which can
contain non-standard terms and conditions and bespoke performance obligations, including transition and transformation programmes
that are complex and require up-front investment by BT and are expected to result in cash inows in future periods.
There is signicant subjectivity in estimating the overall prot or loss that will be recognised over these contract’s terms as this is reliant on
future projections of revenues and costs. As a result, a high degree of judgement is required to determine whether contract-specic assets
are recoverable and to determine the completeness and amount of provisions against contracts projected to be loss-making.
The eect of these matters is that, as part of our risk assessment, we determined that the completeness and amount of provisions against
contracts projected to be loss-making and the recoverability of contract-specic assets has a high degree of estimation uncertainty, with a
potential range of reasonable outcomes greater than our materiality for the nancial statements as a whole.
31 March 2019 Sales:
The revenue recognition process for long-term contracts involves a manual process with a high volume of journals being posted throughout
the year. We have identied a signicant risk of fraud in respect of the existence and amount of revenue recognition on long-term contracts
as a result of these manual journals posted to adjust the revenue recognised, as the volume and materiality of these journals posted results
in an inherent risk that revenue could be materially manipulated.
Our response
Our procedures included:
• Control design and operation: Evaluating the processes and controls over the recoverability of contract-specic assets, estimation of
provisions against contracts projected to be loss-making and fraud risk relating to long-term contract revenue recognition.
Our testing identied weaknesses in the design of these controls. As a result we expanded the extent of our detailed testing over and
above that originally planned.
For the major contracts recoverability of contract-specic assets and estimation of provisions against contracts projected to be
loss-making our procedures included:
Assessing the Directors’ process to identify contracts that have a higher risk of being loss-making, by testing a sample of inputs into
management’s high-risk model and then applying our own criteria (including quantitative and qualitative factors) to that model to select
a sample of contracts which have a higher risk of being loss-making. For the sample of higher risk contracts (which includes those with
provisions against contracts projected to be loss-making as well as others), our procedures included:
• Inquiries of contract management teams: Obtaining an understanding of the performance and status of the contracts through
discussions with contract teams including a mixture of operational and nance personnel.
• Expectation vs outcome: Challenging revenue and cost forecasts, including key assumptions such as cost savings or variations
underpinning the expected lifetime performance, by comparing future projections against past performance;
• Test of details: Obtaining the contractual agreements between BT and the customer and comparing the key obligations and
contractual clauses against the contract risk-registers.
Challenging the Company as to whether all risks had been identied and appropriately valued by comparing risk registers against
contractual obligations and benchmarking common risks across contracts
• Historical accuracy: Assessing the variances between budget and actual results in the past two years for a sample of higher risk
contracts. We used this assessment to inform our sensitivity analysis over the future cash ow projections of the contracts in our high
risk sample and incorporated the results in our challenge of the company over the key assumptions on those contracts.

Independent auditors’ report to the members of BT Group plc continued
Report on the audit of the nancial statements continued
104
BT Group plc Annual Report 2019
For the risk of fraud relating to revenue recognition process for long-term contracts our procedures included:
• Test of details: Reconciling the revenue recognised to the invoices issued during the year. Testing, on a sample basis, the year-end
balance sheet position for contract assets, contract liabilities and trade receivables back to supporting evidence.
Analysing the journal postings to revenue, investigating any unexpected pairings or unusual postings.
Our results
We consider the long-term customer contracts in Global Services and Enterprise to be acceptable.
Adequacy of regulatory and litigation provisions
Regulatory provision £182 million
Litigation provision £84 million
Refer to page 69
Audit & Risk Committee
Report, and page 143 nancial disclosures note 19 Provisions.
The risk
Omitted exposures:
The Group operates in a highly regulated environment and faces legal, competition and regulatory challenges which can lead to potential
claims and exposures (together ‘regulatory and litigation matters’). In certain litigation and regulatory matters signicant judgement is
required to determine whether a liability or contingent liability should be recognised or disclosed, as appropriate.
Subjective estimate:
The amounts involved are potentially signicant, and the application of accounting standards to estimate the amount, if any, to be provided
as a liability inherently subjective.
The eect of these matters is that, as part of our risk assessment, we determined that the regulatory and litigation provisions have a high
degree of estimation uncertainty, with a potential range of reasonable outcomes greater than our materiality for the nancial statements as
a whole.
Our response
Our procedures included:
• Control design and operation: Evaluating the processes and controls over regulatory and legal provisions.
Our testing identied weaknesses in the design and operation of these controls. As a result we expanded the extent of our detailed
testing over and above that originally planned.
For regulatory provisions our procedures included:
• Our regulatory expertise: Analysing, with the support of our own regulatory specialists, the key assumptions, inspecting
correspondence with regulators and monitoring external sources of information.
• Historical comparison: performing procedures over the historical accuracy of the provisions by comparing the previous estimate made
to actual outcomes.
• Sensitivity analysis: sensitising the signicant assumptions to evaluate the reasonableness of the assumptions
• Methodology choice: Assessing whether the bespoke approach to estimating the provision is materially consistent with IAS 37.
For litigation provisions our procedures included:
• Our legal expertise: Analysing, with the support of our own legal specialists, the key assumptions, inspecting correspondence with
Brazilian authorities and assessing the competency and reputation of the directors’ experts.
• Test of details: Inspecting the report produced by internal counsel, accompanied by discussions with that counsel;
• Enquiry of lawyers: On all signicant legal cases, assessing correspondence with the Group’s external counsel accompanied by
discussions and formal conrmations from that counsel;
For both regulatory and litigation our procedures included:
• Assessing transparency: Assessing whether the group’s disclosures detailing signicant regulatory and litigation proceedings
adequately disclose the potential liabilities of the group.
Our results
We consider the provisions recognised, and the contingent liability disclosures made, to be acceptable.
Useful economic lives assigned to internally generated intangible assets
Internally generated intangible assets £1,297 million
Refer to page 69
Audit & Risk Committee
Report, and page 136 nancial disclosures note 14 Intangible assets.

105
BT Group plc Annual Report 2019 Strategic report
Governance
Financial statements
Additional information
The risk
Subjective estimate:
Useful economic lives assigned to internally generated intangible assets contain a greater inherent level of judgement with regards to
appropriate useful economic life in comparison to separately acquired assets.
The eect of these matters is that, as part of our risk assessment, we determined that the useful economic lives assigned to internally
generated intangible assets have a higher degree of estimation uncertainty, with useful economic life less typically derived from underlying
contractual arrangement (in comparison to separately acquired assets), with a potential range of reasonable outcomes greater than our
materiality for the nancial statements as a whole.
Our response
Our procedures included:
• Control design and operation: Evaluating the processes and controls in respect of the determination of the useful economic lives.
• Test of details: Challenging that the directors’ view on asset lives are supportable considering our knowledge of the business, enquiry
of operational managers, inspection of relevant supporting documentation, and benchmarking analysis (where applicable);
• Historical comparisons: Assessing whether the results of prior year asset life reviews, including consideration of fully-depreciated
assets still in use, have been appropriately taken into account when considering asset lives in the current year.
Our results:
We consider the judgements made in relation to the useful economic lives assigned to internally generated intangible assets to be acceptable.
Accuracy of revenue due to the complexity of the billing systems
Refer to page 125 nancial disclosures note 6 Revenue.
The risk
Processing error:
BT non-long-term contract revenue consists of a large number of similar low value transactions. The group operates a number of distinct
billing systems and the IT landscape underpinning revenue and linking the billing systems together is complex.
There are multiple products sold at multiple rates with varying pricing structures in place. Products represent a combination of service based
products, such as xed line telephony, as well as goods, such as the provision of mobile handsets. There are monthly tari based charges, as
well as usage based charges arising on the volume of minutes or data used.
Accuracy of revenue has been determined a key audit matter, as it was a signicant area in the audit of the nancial statements, having the
greatest eect on the allocation of resources in the audit. It is not identied as a signicant risk or an area of signicant auditor judgement.
Our response
Our procedures included:
• Control design and operation: Evaluating the design and testing the operating eectiveness of controls in respect of all major revenue
streams, including controls over:
– the processing of call data records;
– the authorisation of price changes;
– the accuracy of invoicing, and
– cash receipting.
Our testing included those controls over the recording of revenue transactions from the billing system to the general ledger.
Our testing identied weaknesses in the design and operation of these controls. As a result we expanded the extent of our tests of detail
over and above that originally planned.
• Test of details: Comparing a sample of customer bills to supporting evidence eg orders, contracts, call detail records (where applicable)
and cash received.
Our results:
We consider revenue relating to non-long-term contract revenue to be acceptable.
Recoverability of parent company’s investment in subsidiary and loans to group undertakings
Investment in subsidiary £10,952 million
Refer to page 175 accounting policy on investments and page 175 nancial disclosures note 2 Investments.
Loans to group undertakings £5,657 million
Refer to page 116 accounting policy Impairment of nancial assets.

Independent auditors’ report to the members of BT Group plc continued
Report on the audit of the nancial statements continued
106
BT Group plc Annual Report 2019
The risk
Low risk, high value:
The carrying amount of the parent company’s investment in subsidiary and the amount of the loans to group undertakings represent 66%
and 34% respectively, of the company’s total assets as at 31 March 2019.
Their recoverability is not considered a signicant risk or subject to signicant judgement. However, due to their materiality in the context
of the parent company nancial statements, these are considered to be the areas that will have the greatest eect on our overall parent
company audit.
Our response
Our procedures included:
– Test of details: Comparing the carrying amount of the parent company’s investment and loans to group undertakings, with the
relevant subsidiary draft balance sheet to identify whether their net assets, being an approximation of their minimum recoverable
amount, were in excess of their carrying amount and assessing whether those subsidiaries have historically been prot-making.
Our results
We consider the group’s assessment of the recoverability of the investment in subsidiaries and debt due from group entities to be
acceptable.
3 Our application of materiality and an overview of the scope of our audit
Materiality for the group nancial statements as a whole was set at £115 million, determined with reference to a benchmark of Group
prot before tax from continuing operations of which it represents 4.3%.
Materiality for the parent company nancial statements as a whole was set at £110 million, determined with reference to a benchmark of
total assets, of which it represents 0.7%, and chosen to be lower than materiality for the group nancial statements as a whole.
We agreed to report to the Audit & Risk Committee any corrected or uncorrected identied misstatements exceeding £5.5 million, in
addition to other identied misstatements that warranted reporting on qualitative grounds.
Scope of our audit
Of the Group’s seven reporting components (one being the parent company), all were subjected to full scope audits. Work on the Group’s
entire property, plant and equipment balance was performed by the component auditor of the Technology component on behalf of the
Group and component teams.
The components within the scope of our work accounted for the following percentages:
Group prot before tax Group revenue Group total assets
Audits for group reporting purposes 97% 99% 100%
The Group team instructed component auditors as to the signicant areas to be covered, including the relevant risks detailed above and the
information to be reported back. In the case of the Technology component, the Group team provided instructions of the audit of account
balance to be performed over the property, plant and equipment on behalf of the Group and component teams.
The component materialities ranged from £40m to £110m, having regard to the mix of size and risk prole of the Group across the
components.
The work on all of the components, excluding the audit of the parent company, was performed by component auditors. The parent
company was audited by the Group team. All of the component audit teams were based in the UK. The Group engagement team met
frequently in person with the component audit teams as part of the audit planning and completion phases to explain our audit instructions
and discuss the component auditors’ plans as well as performing more detailed le reviews upon completion of the component auditors’
engagements. Telephone conference meetings were also held with these component auditors.
At these meetings with component auditors, the ndings reported to the Group team were discussed in more detail, and any further work
required by the Group team was then performed by the component auditor.
4 We have nothing to report on going concern
The Directors have prepared the nancial statements on the going concern basis as they do not intend to liquidate the Company or the
Group or to cease their operations, and as they have concluded that the Company’s and the Group’s nancial position means that this
is realistic. They have also concluded that there are no material uncertainties that could have cast signicant doubt over their ability to
continue as a going concern for at least a year from the date of approval of the nancial statements (“the going concern period”).

107
BT Group plc Annual Report 2019 Strategic report
Governance
Financial statements
Additional information
Our responsibility is to conclude on the appropriateness of the Directors’ conclusions and, had there been a material uncertainty related
to going concern, to make reference to that in this audit report. However, as we cannot predict all future events or conditions and as
subsequent events may result in outcomes that are inconsistent with judgements that were reasonable at the time they were made, the
absence of reference to a material uncertainty in this auditor’s report is not a guarantee that the Group and the Company will continue in
operation.
In our evaluation of the Directors’ conclusions, we considered the inherent risks to the Group’s and Company’s business model and analysed
how those risks might aect the Group’s and Company’s nancial resources or ability to continue operations over the going concern period.
The risks that we considered most likely to adversely aect the Group’s and Company’s available nancial resources over this period were:
• The impact of a signicant reduction in protability arising from one, or a combination of, the principal risks outlined in the Group’s
strategic report on page 46.
• The impact of a tightening in capital markets that would adversely aect the Company’s ability to raise future debt.
As these were risks that could potentially cast signicant doubt on the Group’s and the Company’s ability to continue as a going concern,
we considered sensitivities over the level of available nancial resources indicated by the Group’s nancial forecasts taking account of
reasonably possible (but not unrealistic) adverse eects that could arise from these risks individually and collectively and evaluated the
achievability of the actions the Directors consider they would take to improve the position should the risks materialise. We also considered
less predictable but realistic second order impacts, such as the impact of a disorderly Brexit and the erosion of customer or supplier
condence, which could result in a rapid reduction of available nancial resources.
Based on this work, we are required to report to you if:
• we have anything material to add or draw attention to in relation to the directors’ statement in Note 1 to the nancial statements on
the use of the going concern basis of accounting with no material uncertainties that may cast signicant doubt over the Group and
Company’s use of that basis for a period of at least twelve months from the date of approval of the nancial statements; or
• the related statement under the Listing Rules set out on page 98 is materially inconsistent with our audit knowledge.
We have nothing to report in these respects, and we did not identify going concern as a key audit matter.
5 We have nothing to report on the other information in the Annual Report
The directors are responsible for the other information presented in the Annual Report together with the nancial statements. Our opinion
on the nancial statements does not cover the other information and, accordingly, we do not express an audit opinion or, except as
explicitly stated below, any form of assurance conclusion thereon.
Our responsibility is to read the other information and, in doing so, consider whether, based on our nancial statements audit work, the
information therein is materially misstated or inconsistent with the nancial statements or our audit knowledge. Based solely on that work
we have not identied material misstatements in the other information.
Strategic report and directors’ report
Based solely on our work on the other information:
• we have not identied material misstatements in the strategic report and the directors’ report;
• in our opinion the information given in those reports for the nancial year is consistent with the nancial statements; and
• in our opinion those reports have been prepared in accordance with the Companies Act 2006.
Directors’ remuneration report
In our opinion the part of the Directors’ Remuneration Report to be audited has been properly prepared in accordance with the Companies
Act 2006.

Independent auditors’ report to the members of BT Group plc continued
Report on the audit of the nancial statements continued
108
BT Group plc Annual Report 2019
Disclosures of principal risks and longer-term viability
Based on the knowledge we acquired during our nancial statements audit, we have nothing material to add or draw attention
to in relation to:
• the directors’ conrmation within the Directors’ information on page 92 that they have carried out a robust assessment of the principal
risks facing the Group, including those that would threaten its business model, future performance, solvency and liquidity;
• the principal risks and uncertainties disclosures describing these risks and explaining how they are being managed and mitigated; and
• the directors’ explanation in the viability statement of how they have assessed the prospects of the Group, over what period they have
done so and why they considered that period to be appropriate, and their statement as to whether they have a reasonable expectation
that the Group will be able to continue in operation and meet its liabilities as they fall due over the period of their assessment, including
any related disclosures drawing attention to any necessary qualications or assumptions.
Under the Listing Rules we are required to review the viability statement. We have nothing to report in this respect.
Our work is limited to assessing these matters in the context of only the knowledge acquired during our nancial statements audit. As we
cannot predict all future events or conditions and as subsequent events may result in outcomes that are inconsistent with judgements that
were reasonable at the time they were made, the absence of anything to report on these statements is not a guarantee as to the Group’s
and Company’s longer-term viability.
Corporate governance disclosures
We are required to report to you if:
• we have identied material inconsistencies between the knowledge we acquired during our nancial statements audit and the
directors’ statement that they consider that the annual report and nancial statements taken as a whole is fair, balanced and
understandable and provides the information necessary for shareholders to assess the Group’s position and performance, business
model and strategy; or
• the section of the annual report describing the work of the Audit Committee does not appropriately address matters communicated by
us to the Audit Committee.
We are required to report to you if the Corporate Governance Statement does not properly disclose a departure from the eleven provisions
of the UK Corporate Governance Code specied by the Listing Rules for our review.
We have nothing to report in these respects.
6 We have nothing to report on the other matters on which we are required to report by exception
Under the Companies Act 2006, we are required to report to you if, in our opinion:
• adequate accounting records have not been kept by the parent Company, or returns adequate for our audit have not been received
from branches not visited by us; or
• the parent Company nancial statements and the part of the Directors’ Remuneration Report to be audited are not in agreement with
the accounting records and returns; or
• certain disclosures of directors’ remuneration specied by law are not made; or
• we have not received all the information and explanations we require for our audit.
We have nothing to report in these respects.
7 Respective responsibilities
Directors’ responsibilities
As explained more fully in their statement set out on page 92, the directors are responsible for: the preparation of the nancial statements
including being satised that they give a true and fair view; such internal control as they determine is necessary to enable the preparation
of nancial statements that are free from material misstatement, whether due to fraud or error; assessing the Group and parent Company’s
ability to continue as a going concern, disclosing, as applicable, matters related to going concern; and using the going concern basis of
accounting unless they either intend to liquidate the Group or the parent Company or to cease operations, or have no realistic alternative
but to do so.
Auditor’s responsibilities
Our objectives are to obtain reasonable assurance about whether the nancial statements as a whole are free from material misstatement,
whether due to fraud or other irregularities (see below), or error, and to issue our opinion in an auditor’s report. Reasonable assurance
is a high level of assurance, but does not guarantee that an audit conducted in accordance with ISAs (UK) will always detect a material
misstatement when it exists. Misstatements can arise from fraud, other irregularities or error and are considered material if, individually or
in aggregate, they could reasonably be expected to inuence the economic decisions of users taken on the basis of the nancial statements.
A fuller description of our responsibilities is provided on the FRC’s website at www.frc.org.uk/auditorsresponsibilities.

109
BT Group plc Annual Report 2019 Strategic report
Governance
Financial statements
Additional information
Irregularities – ability to detect
We identied areas of laws and regulations that could reasonably be expected to have a material eect on the nancial statements
from our general commercial and sector experience and through discussion with the directors and other management (as required
by auditing standards), and from inspection of the group’s regulatory and legal correspondence and discussed with the directors and
other management the policies and procedures regarding compliance with laws and regulations. We communicated identied laws
and regulations throughout our team and remained alert to any indications of non-compliance throughout the audit. This included
communication from the group to component audit teams of relevant laws and regulations identied at group level.
The potential eect of these laws and regulations on the nancial statements varies considerably.
Firstly, the group is subject to laws and regulations that directly aect the nancial statements including nancial reporting legislation
(including related companies legislation), distributable prots legislation, taxation legislation, and pension legislation and we assessed the
extent of compliance with these laws and regulations as part of our procedures on the related nancial statement items.
Secondly, the group is subject to many other laws and regulations where the consequences of non-compliance could have a material
eect on amounts or disclosures in the nancial statements, for instance through the imposition of nes or litigation or the loss of the
group’s licence to operate. We identied the following areas as those most likely to have such an eect: anti-bribery, regulations aecting
telecommunications providers, and certain aspects of company legislation recognising the nancial and regulated nature of the group’s
activities (reecting compliance with Ofcom regulation). Auditing standards limit the required audit procedures to identify non-compliance
with these laws and regulations to enquiry of the directors and other management and inspection of regulatory and legal correspondence,
if any. These limited procedures did not identify actual or suspected non-compliance. Further details in respect of regulations over products
subject to charge controls and other regulated pricing regimes is set out in the key audit matter disclosures in section 2 of this report.
Owing to the inherent limitations of an audit, there is an unavoidable risk that we may not have detected some material misstatements
in the nancial statements, even though we have properly planned and performed our audit in accordance with auditing standards. For
example, the further removed non-compliance with laws and regulations (irregularities) is from the events and transactions reected in the
nancial statements, the less likely the inherently limited procedures required by auditing standards would identify it. In addition, as with
any audit, there remained a higher risk of non-detection of irregularities, as these may involve collusion, forgery, intentional omissions,
misrepresentations, or the override of internal controls. We are not responsible for preventing non-compliance and cannot be expected to
detect non-compliance with all laws and regulations.
8 The purpose of our audit work and to whom we owe our responsibilities
This report is made solely to the Company’s members, as a body, in accordance with Chapter 3 of Part 16 of the Companies Act 2006 and
the terms of our engagement by the company. Our audit work has been undertaken so that we might state to the Company’s members
those matters we are required to state to them in an auditor’s report, and the further matters we are required to state to them in
accordance with the agreed terms with the company, and for no other purpose. To the fullest extent permitted by law, we do not accept or
assume responsibility to anyone other than the Company and the Company’s members, as a body, for our audit work, for this report, or for
the opinions we have formed.
Antony Cates (Senior Statutory Auditor)
for and on behalf of KPMG LLP, Statutory Auditor
Chartered Accountants
15 Canada Square
London
E14 5GL
8 May 2019

110
BT Group plc Annual Report 2019
Group income statement
Year ended 31 March 2019
Notes
Before
specific items
(‘Adjusted’)
£m
Specific
items
a
£m
Total
(Reported)
£m
Revenue 5, 6 23,459 (31) 23,428
Operating costs 7 (19,613) (394) (20,007)
Operating profit (loss) 5 3,846 (425) 3,421
Finance expense 26 (651) (139) (790)
Finance income 34 – 34
Net finance expense (617) (139) (756)
Share of post tax profit (loss) of associates and joint ventures 1 – 1
Profit (loss) before taxation 3,230 (564) 2,666
Taxation 11 (619) 112 (507)
Profit (loss) for the year 2,611 (452) 2,159
Earnings per share 12
Basic 21.8p
Diluted 21.6p
Year ended 31 March 2018
Notes
Before
specific items
(‘Adjusted’)
£m
Specific
items
a
£m
Total
(Reported)
£m
Revenue 5, 6 23,746 (23) 23,723
Operating costs 7 (19,755) (587) (20,342)
Operating profit (loss) 5 3,991 (610) 3,381
Finance expense 26 (558) (218) (776)
Finance income 12 – 12
Net finance expense (546) (218) (764)
Share of post tax profit (loss) of associates and joint ventures (1) – (1)
Profit (loss) before taxation 3,444 (828) 2,616
Taxation 11 (671) 87 (584)
Profit (loss) for the year 2,773 (741) 2,032
Earnings per share 12
Basic 20.5p
Diluted 20.4p
a
For a definition of specific items, see page 185. An analysis of specific items is provided in note 10.

BT Group plc Annual Report 2019
111
Strategic report
Governance
Financial statements
Additional information
Group income statement
Year ended 31 March 2017
Notes
Before
specific items
(‘Adjusted’)
£m
Specific
items
a
£m
Total
(Reported)
£m
Revenue 5, 6 24,082 (20) 24,062
Operating costs 7 (19,947) (948) (20,895)
Operating profit (loss) 5 4,135 (968) 3,167
Finance expense 26 (607) (210) (817)
Finance income 13 – 13
Net finance expense (594) (210) (804)
Share of post tax profit (loss) of associates and joint ventures (9) – (9)
Profit (loss) before taxation 3,532 (1,178) 2,354
Taxation 11 (663) 217 (446)
Profit (loss) for the year 2,869 (961) 1,908
Earnings per share 12
Basic 19.2p
Diluted 19.1p
a
For a definition of specific items, see page 185. An analysis of specific items is provided in note 10.
Group statement of comprehensive income
Year ended 31 March
Notes
2019
£m
2018
(Restated)
a
£m
2017
£m
Profit for the year 2,159 2,032 1,908
Other comprehensive income (loss)
Items that will not be reclassified to the income statement
Remeasurements of the net pension obligation 20 (2,102) 1,684 (2,789)
Tax on pension remeasurements 11 384 (263) 416
Items that have been or may be reclassified to the income statement
Exchange differences on translation of foreign operations 28 64 (188) 237
Fair value movements on available-for-sale assets 28 – 11 (3)
Fair value movements on assets at fair value through other comprehensive income 28 3 – –
Movements in relation to cash flow hedges:
net fair value gains (losses) 28 176 (368) 884
recognised in income and expense 28 (18) 277 (938)
Tax on components of other comprehensive income that have been or may be reclassified 11, 28 (41) 1 29
Other comprehensive income (loss) for the year, net of tax (1,534) 1,154 (2,164)
Total comprehensive income (loss) for the year 625 3,186 (256)
a
Certain results have been restated to reflect the update to the calculation of our IAS 19 accounting valuation of retirement benefit obligations. See note 2 to the consolidated financial statements.

112
BT Group plc Annual Report 2019
Group balance sheet
At 31 March
Notes
2019
£m
2018
(Restated)
a
£m
2017
£m
Non-current assets
Intangible assets 14 14,385 14,447 15,029
Property, plant and equipment 15 17,835 17,000 16,498
Derivative financial instruments 27 1,481 1,312 1,818
Investments 23 54 53 44
Associates and joint ventures 47 38 31
Trade and other receivables 17 445 317 360
Contract assets
b
6 249 – –
Deferred tax assets 11 1,347 1,326 1,717
35,843 34,493 35,497
Current assets
Programme rights 16 310 272 264
Inventories 369 239 227
Trade and other receivables 17 3,222 4,014 3,835
Contract assets
b
6 1,353 – –
Assets held for sale 89 – –
Current tax receivable 110 77 73
Derivative financial instruments 27 111 197 428
Investments 23 3,214 3,022 1,520
Cash and cash equivalents 24 1,666 528 528
10,444 8,349 6,875
Current liabilities
Loans and other borrowings 25 2,100 2,281 2,632
Derivative financial instruments 27 48 50 34
Trade and other payables 18 5,790 7,168 7,437
Contract liabilities
b
6 1,225 – –
Current tax liabilities 15 83 197
Provisions 19 424 603 625
9,602 10,185 10,925
Total assets less current liabilities 36,685 32,657 31,447
Non-current liabilities
Loans and other borrowings 25 14,776 11,994 10,081
Derivative financial instruments 27 892 787 869
Contract liabilities
b
6 200 – –
Retirement benefit obligations 20 7,182 6,847 9,088
Other payables 18 1,479 1,326 1,298
Deferred tax liabilities 11 1,407 1,340 1,240
Provisions 19 582 452 536
26,518 22,746 23,112
Equity
Share capital 499 499 499
Share premium 1,051 1,051 1,051
Own shares 21 (167) (186) (96)
Merger reserve 4,147 6,647 6,647
Other reserves 28 718 534 884
Retained earnings 3,919 1,366 (650)
Total equity 10,167 9,911 8,335
36,685 32,657 31,447
a
Certain results have been restated to reflect the update to the calculation of our IAS 19 accounting valuation of retirement benefit obligations. See note 2 to the consolidated financial statements.
b
Contract assets and contract liabilities arise following adoption of IFRS 15 on 1 April 2018. See notes 1 and 2 to the consolidated financial statements.
The consolidated financial statements on pages 110 to 184 were approved by the Board of Directors on 8 May 2019 and were signed
on its behalf by:
Jan du Plessis
Chairman
Philip Jansen
Chief Executive
Simon Lowth
Chief Financial Officer

BT Group plc Annual Report 2019
113
Strategic report
Governance
Financial statements
Additional information
Group statement of changes in equity
Notes
Share
capital
a
£m
Share
premium
b
£m
Own
shares
c
£m
Merger
reserve
d
£m
Other
reserves
e
£m
Retained
(loss)
earnings
(Restated)
f
£m
Total
equity
(deficit)
(Restated)
£m
At 1 April 2016 499 1,051 (115) 8,422 685 (430) 10,112
Profit for the year –––––1,908 1,908
Other comprehensive income (loss) – before tax ––––1,108 (2,779) (1,671)
Tax on other comprehensive income (loss) 11 ––––29416445
Transferred to the income statement ––––(938) – (938)
Total comprehensive income (loss) for the year ––––199(455) (256)
Transfers to realised profit – – – (1,775) – 1,775 –
Dividends to shareholders 13 –––––(1,436) (1,436)
Share-based payments 22 –––––5757
Tax on share-based payments 11 –––––(6)(6)
Net buyback of own shares 21 – – 19 – – (155) (136)
At 1 April 2017 499 1,051 (96) 6,647 884 (650) 8,335
Profit for the year –––––2,032 2,032
Other comprehensive income (loss) – before tax ––––(545) 2,160 1,615
Tax on other comprehensive income (loss) 11 ––––1(346) (345)
Transferred to the income statement ––––277–277
Total comprehensive income (loss) for the year ––––(267) 3,846 3,579
Dividends to shareholders 13 –––––(1,524) (1,524)
Share-based payments 22 –––––8484
Tax on share-based payments 11 –––––(2)(2)
Net buyback of own shares 21 – – (90) – – (78) (168)
Transfer to realised profit ––––(83) 83 –
At 31 March 2018 – as previously reported 499 1,051 (186) 6,647 534 1,759 10,304
Pension restatement
f
–––––(393) (393)
At 31 March 2018 – restated 499 1,051 (186) 6,647 534 1,366 9,911
IFRS opening balance adjustment
g
–––––1,308 1,308
Tax on IFRS opening balance adjustment
g
–––––(248) (248)
At 1 April 2018 499 1,051 (186) 6,647 534 2,426 10,971
Profit for the year –––––2,159 2,159
Other comprehensive income (loss) – before tax ––––243(2,102) (1,859)
Tax on other comprehensive income (loss) 11 ––––(41) 384 343
Transferred to the income statement ––––(18) – (18)
Total comprehensive income (loss) for the year ––––184441625
Dividends to shareholders 13 –––––(1,503) (1,503)
Unclaimed Dividend over 10 years –––––1414
Share-based payments 22 –––––6767
Tax on share-based payments 11 –––––– –
Net buyback of own shares 21 – – 19 – – (23) (4)
Transfer to realised profit – – – (2,500) – 2,500 –
Other movements –––––(3)(3)
At 31 March 2019 499 1,051 (167) 4,147 718 3,919 10,167
a
The allotted, called up, and fully paid ordinary share capital of BT Group plc at 31 March 2019 was £499m comprising 9,968,127,681 ordinary shares of 5p each (2018: £499m comprising
9,968,127,681 ordinary shares of 5p each).
b
The share premium account, comprising the premium on allotment of shares, is not available for distribution.
c
For further analysis of own shares, see note 21.
d
The merger reserve balance at 1 April 2016 includes £998m related to the group reorganisation that occurred in November 2001 and represented the difference between the nominal value of shares in
the new parent company, BT Group plc, and the aggregate of the share capital, share premium account and capital redemption reserve of the prior parent company, British Telecommunications plc. In
addition, on 29 January 2016, the company issued 1,594,900,429 ordinary shares of 5p at 470.7p per share. These shares were used as part consideration for the acquisition of EE. As a result of this
transaction the merger reserve was credited with £7,424m net of £3m issue costs. Following settlement of intercompany loans by qualifying consideration of £1,775m (2016/17) and £2,500m
(2018/19), equivalent balances were transferred from merger reserve to realised profit.
e
For further analysis of other reserves, see note 28.
f
Certain results have been restated to reflect the update to the calculation of our IAS 19 accounting valuation of retirement benefit obligations. See note 2 to the consoliated financial statements.
g
Opening retained earnings adjusted following adoption of IFRS 15 on 1 April 2018. See notes 1 and 2 to the consolidated financial statements.

114
BT Group plc Annual Report 2019
Group cash flow statement
Year ended 31 March
Notes
2019
£m
2018
£m
2017
£m
Cash flow from operating activities
Profit before taxation 2,666 2,616 2,354
Share of post tax (profit) loss of associates and joint ventures (1) 1 9
Net finance expense 756 764 804
Operating profit 3,421 3,381 3,167
Other non-cash charges (112) 33 20
Loss (profit) on disposal of businesses 5 (1) (16)
Depreciation and amortisation 3,546 3,514 3,572
Increase in inventories (138) (14) (33)
Decrease (increase) in programme rights 49 (34) (95)
(Increase) decrease in trade and other receivables
a
(58) (156) 168
Decrease in contract assets
b
15 – –
Increase (decrease) in trade and other payables 57 (345) (152)
Decrease in contract liabilities
b
(72) – –
Decrease in other liabilities
c
(1,934) (775) (307)
(Decrease) increase in provisions (92) (203) 401
Cash generated from operations 4,687 5,400 6,725
Income taxes paid (431) (473) (551)
Net cash inflow from operating activities 4,256 4,927 6,174
Cash flow from investing activities
Interest received 23 7 7
Dividends received from associates and joint ventures – – 2
Acquisition of subsidiaries
d
– (16) 18
Proceeds on disposal of subsidiaries
d
, associates and joint ventures 23 2 46
Acquisition of joint ventures (9) (9) (13)
Proceeds on disposal of current financial assets
e
12,887 11,134 10,834
Purchases of current financial assets
e
(13,088) (12,629) (9,411)
Proceeds on disposal of non-current asset investments
f
119–
Purchases of non-current asset investments – – (22)
Proceeds on disposal of property, plant and equipment 41 21 26
Purchases of property, plant and equipment and software (3,678) (3,362) (3,145)
Net cash outflow from investing activities (3,800) (4,833) (1,658)
Cash flow from financing activities
Equity dividends paid (1,504) (1,523) (1,435)
Interest paid (531) (555) (629)
Repayment of borrowings
g
(1,423) (1,401) (1,805)
Proceeds from bank loans and bonds 3,972 3,760 3
Cash flows from derivatives related to net debt 124 (188) 119
Repayment of acquisition facility – – (181)
Repayment of EE revolving credit facility – – (438)
Proceeds from issue of own shares 55370
Repurchase of ordinary share capital (9) (221) (206)
Net cash inflow (outflow) from financing activities 634 (75) (4,502)
Net increase in cash and cash equivalents 1,090 19 14
Opening cash and cash equivalents
h
499 511 459
Net increase in cash and cash equivalents 1,090 19 14
Effect of exchange rate changes 5 (31) 38
Closing cash and cash equivalents
h
24 1,594 499 511
a
Includes a prepayment of £nil (2017/18: £325m, 2016/17: £nil) in respect of the acquisition of Spectrum.
b
Contract assets and contract liabilities arise following adoption of IFRS 15 on 1 April 2018. See notes 1 and 2 to the consolidated financial statements.
c
Includes pension deficit payments of £2,024m (2017/18: £872m, 2016/17: £274m).
d
Acquisitions and disposals of subsidiaries are shown net of cash acquired or disposed of and in 2017 included £20m true-up of consideration following the audit of the completion balance sheet relating to the
acquisition of EE.
e
Primarily consists of investment in and redemption of amounts held in liquidity funds.
f
Relates to sale of fair value through equity investment in 2018/19 and assets held for sale classified within trade and other receivables in 2017/18.
g
Repayment of borrowings includes the impact of hedging and repayment of lease liabilities.
h
Net of bank overdrafts of £72m (2017/18: £29m, 2016/17: £17m).

BT Group plc Annual Report 2019
115
Strategic report
Governance
Financial statements
Additional information
Notes to the consolidated financial statements
1. Basis of preparation
Preparation of the financial statements
These consolidated financial statements have been prepared in
accordance with the Companies Act 2006 as applicable to
companies using International Financial Reporting Standards
(IFRS), Article 4 of the IAS Regulation and International
Accounting Standards (IAS) and IFRS and related interpretations,
as adopted by the European Union. The consolidated financial
statements are also in compliance with IFRS as issued by the
International Accounting Standards Board (the IASB) and
interpretations as issued by the IFRS Interpretations Committee.
The consolidated financial statements are prepared on a going
concern basis.
These financial statements consolidate BT Group plc, the parent
company, and its subsidiaries (together the ‘group’, ‘us’, ‘we’
or ‘our’).
The consolidated financial statements are prepared on the
historical cost basis, except for certain financial and equity
instruments that have been measured at fair value. The
consolidated financial statements are presented in sterling, the
functional currency of BT Group plc.
New and amended accounting standards effective
during the year
The following standards have been adopted during the year and
have a significant impact on the financial statements.
IFRS 15 ‘Revenue from Contracts with Customers’
Background
IFRS 15 sets out the requirements for recognising revenue and
costs from contracts with customers and includes extensive
disclosure requirements. It replaced IAS 18 ‘Revenue’ and related
interpretations. The standard requires us to apportion revenue
earned from contracts to individual promises, or performance
obligations, on a relative stand-alone selling price basis, based on
a five-step model.
Transition
We chose to adopt IFRS 15 using the cumulative effect method.
Under this transition method:
• the standard has been applied only to contracts in progress but
not completed as at 1 April 2018
• for contracts that were modified before 1 April 2018, the
aggregate effect of all of the modifications that occurred
before this date are reflected as at 1 April 2018
• prior year comparatives have not been restated for the effect
of IFRS 15 and continue to be reported under IAS 18. Instead
our 1 April 2018 opening retained earnings have been
adjusted for the full cumulative impact of adopting the
standard.
Financial Impact
In the prior year Annual Report we estimated that the likely
impact on transition at 1 April 2018 would produce a cumulative
increase in retained earnings of between £1.1bn and £1.5bn
before tax. The actual increase of £1.3bn before tax (£1.1bn
after tax) has primarily been recorded as a contract asset and has
led to an additional one-off cash tax payment equally split
between 2018/19 and 2019/20.
The cumulative increase in retained earnings is mainly due to the
acceleration of handset revenues and, to a lesser extent, deferral
of costs, notably third-party contract acquisition costs primarily
associated with post pay contracts.
The financial impact of each business area is as follows:
• Under our previous accounting policy, mobile handset revenue
was recognised based on the amount the customer pays for the
handset when it is delivered to the customer. Generally mobile
handsets are either provided free or for a small upfront charge.
Under IFRS 15, additional revenue is allocated to the mobile
handset at the start of the contract. This is calculated with
reference to its relative standalone value within the contract,
regardless of the contract pricing. For each mobile handset
contract, the revenue recognition profile changes with greater
day one recognition of revenue for the handset and a
corresponding reduction in ongoing mobile service revenue over
the contract period. The difference between the mobile handset
revenue recognised and the amounts charged to the customer
has been recognised as a contract asset. Over time, we expect
the contract asset generated to remain at similar levels as old
contracts expire and new ones are signed. However, we will see
short-term volatility, for example around key handset launches.
This primarily impacted Consumer, and to a lesser extent, mobile
handset revenues in Enterprise in respect of the legacy EE
business division. There is a similar effect in respect of subsidised
equipment although this had a less significant impact due to its
lower relative standalone value.
• Previously, sales commissions and other third-party acquisition
costs resulting directly from securing contracts with customers
were expensed when incurred. Under IFRS 15, these costs are
recognised as an asset, and amortised over the period in which
the corresponding benefit is received, resulting in earlier profit
recognition. The impact is greatest in Consumer in respect of
third-party acquisition costs partially associated with post-pay
contracts.
• The above two impacts are partly offset by the change in
accounting for connections revenue. Previously, the group
recognised connections revenue upon performance of the
connection activity. Under IFRS 15, connections revenue is
deferred and recognised on a straight-line basis over the
associated line/circuit contractual period. This means that
revenue and profits are recognised later. On transition this
created a contract liability as revenue and profits are deferred
to future periods. Openreach and Enterprise deliver the
majority of this service and therefore experienced the majority
of the impact. Over time, this liability is expected to remain at
similar levels as old contracts expire and new ones are signed.
• We will provide for expected lifetime losses on contract assets
as required by IFRS 9 as set out below.
• The IFRS 15 impact on other areas was not material. This
included certain contract fulfilment costs which are recognised
as an asset and amortised over the period in which benefit is
received and certain expenses that are recognised as a
deduction from revenue.

116
BT Group plc Annual Report 2019
Notes to the consolidated financial statements continued
1. Basis of preparation continued
The impact of the adoption of IFRS 15 on opening retained
earnings at 1 April 2018 is shown in note 2. The following tables
show, for the year ended 31 March 2019, the impact had the
IFRS 15 standard not been adopted on the financial statement
line items affected for the income statement and balance sheet.
There was no net impact on the key cash flow captions (net cash
flow from operating activities, net cash flow from investing
activities or net cash flow from financing activities).
Group income statement
Year ended 31 March 2019
As
reported
(IFRS 15)
£m
Adjustments
£m
Without
adoption
of IFRS 15
(IAS 18)
£m
Revenue 23,428 (252) 23,176
Operating costs (20,007) 1 (20,006)
Operating profit 3,421 (251) 3,170
Profit before tax 2,666 (251) 2,415
Tax (507) 48 (459)
Profit for the year 2,159 (203) 1,956
Earnings per share – basic 21.8p (2.1p) 19.7p
Earnings per share – diluted 21.6p (2.0p) 19.6p
Group balance sheet
As at 31 March 2019
As
reported
(IFRS 15)
£m
Adjustments
£m
Without
adoption
of IFRS 15
(IAS 18)
£m
Non-current assets
Contract assets 249 (249) –
Trade and other receivables 445 (149) 296
Current assets
Contract assets 1,353 (1,353) –
Trade and other receivables 3,222 180 3,402
Current tax receivable 110 296 406
Current liabilities
Trade and other payables 5,790 1,313 7,103
Contract liabilities 1,225 (1,225) –
Total assets less current
liabilities 36,685 (1,363) 35,322
Non-current liabilities
Other payables 1,479 102 1,581
Contract liabilities 200 (200) –
Equity
Retained earnings 3,919 (1,265) 2,654
Total equity and non-current
liabilities 36,685 (1,363) 35,322
Disclosures
IFRS 15 requires additional disclosures in our Annual Report. To
reflect these expanded requirements we have added a dedicated
revenue note (note 6). The key disclosure changes are as follows:
• we have changed our revenue disclosures to comply with the
requirements to disaggregate revenue recognised from
contracts with customers into categories that depict how the
nature, amount, timing and uncertainty of revenue and
associated cash flows are affected by economic factors
• we have provided further detail around contract balances and
their movements in the year
• we have provided an aggregate amount of the transaction price
allocated to performance obligations that are unsatisfied as at
the end of the reporting period and an explanation of when
these are expected to be recognised as revenue.
IFRS 9 ‘Financial Instruments’
IFRS 9 sets out requirements for classification, measurement,
impairment and de-recognition of financial assets and liabilities,
and includes a new hedge accounting model. It replaces IAS 39
‘Financial Instruments: Recognition and Measurement’. The
standard has not had a material impact on our results, with the
key impacts set out below.
Impairment of financial assets
We have revised the methodologies we use to impair financial
assets to reflect the forward-looking ‘expected credit loss’ model
introduced by IFRS 9, in contrast to the backward-looking
‘incurred credit loss’ model used under IAS 39. As a result we now
recognise a loss allowance for all expected credit losses on initial
recognition of financial assets, including trade receivables and the
contract assets recognised on transition to IFRS 15. Providing for
loss allowances on our existing financial assets has not had a
material impact on the financial statements.
Classification of financial instruments
IFRS 9 introduces new categories of financial instrument: fair
value through profit and loss, fair value through other
comprehensive income, and amortised cost. These replace the
IAS 39 categories of fair value through profit and loss,
available-for-sale, loans and receivables, and held-to-maturity.
We have reclassified our financial instruments based on these new
categories. Certain investments in liquidity funds, disclosed in
note 23, were classified as available-for-sale under IAS 39 but
have been reclassified to amortised cost under IFRS 9, because
they are held to collect contractual cash flows. All other financial
instruments classified as available-for-sale under IAS 39,
including all equity instruments, have been reclassified as fair
value through other comprehensive income under IFRS 9. All
financial instruments previously classified as loans and receivables
and held-to-maturity under IAS 39 have been reclassified as
amortised cost under IFRS 9, and the classification of all
instruments classified as fair value through profit and loss under
IAS 39 is unchanged under IFRS 9.
Reclassification of liquidity fund investments has not had a
material impact on the accounting as they are short-term in
nature and amortised cost can reasonably be expected to equate
to fair value. The reclassifications have not changed the
accounting for any other instruments and therefore their carrying
amounts are unchanged under IFRS 9.
Hedging
We have chosen to adopt the IFRS 9 hedge accounting
requirements because they enable us to align our hedge
accounting more closely with our risk management activities in

BT Group plc Annual Report 2019
117
Strategic report
Governance
Financial statements
Additional information
1. Basis of preparation continued
the future. Adoption of the revised requirements has had no
impact on the effectiveness of our existing hedges, however, it
has been necessary for us to revise hedge documentation to
ensure compliance with enhanced IFRS 9 documentation
requirements.
We have taken the exemption not to restate comparative
information for prior periods with respect to classification and
measurement requirements, including the move to the expected
credit loss model. Consequently, we have not restated prior
period comparatives on adoption of IFRS 9.
Other standards
The following amended standards and interpretations were also
effective during the year, however, they have not had a
significant impact on our consolidated financial statements.
• Classification and Measurement of Share-based Payment
Transactions (Amendments to IFRS 2).
• Applying IFRS 9 Financial Instruments with IFRS 4 Insurance
Contracts (Amendments to IFRS 4).
• Transfers of investment property (Amendments to IAS 40).
• Annual Improvements to IFRS Standards 2014–2016 Cycle –
various standards.
• IFRIC 22 Foreign currency transactions and advance
consideration.
New and amended accounting standards that have been issued
but are not yet effective
IFRS 16 ‘Leases’ is effective for the accounting period starting
1 April 2019 and will have a material impact on our financial
statements.
Background
IFRS 16 was published in January 2016 and replaces IAS 17
‘Leases’ and related interpretations. The standard requires lessees
to recognise a right-of-use asset and lease liability for all leases
meeting the lease definition set out by the standard unless certain
exemptions are available. Accounting for lessors is largely
unchanged.
Transition
We will adopt IFRS 16 on a modified retrospective basis. On
transition, remaining payments payable under lease
arrangements will be discounted using an appropriate
incremental borrowing rate and recognised as lease liabilities.
Right-of-use assets will be recognised equivalent to the lease
liability, adjusted for any pre-existing prepaid lease payments,
accrued lease expenses, and related onerous lease and
decommissioning provisions.
We will recognise the cumulative effect of initially applying the
standard as an adjustment to the opening balance of retained
earnings at 1 April 2019, ie the date of initial application. Results
in the 2019/20 financial year will be reported under IFRS 16 and
the Annual Report 2020 will be the first Annual Report to include
the results on this basis.
We have made significant progress in implementing the standard.
A cross-functional project team has been engaged in identifying
arrangements in scope of IFRS 16, determining appropriate
accounting policies and judgements, and implementing a system
solution capable of quantifying the impact of the standard and
processing accounting entries on a business-as-usual basis.
Practical expedients and judgements
We have elected to make use of the following practical expedients
and exemptions available under IFRS 16:
• low-value leases and short-term leases will be excluded from
IFRS 16 accounting, ie they will be accounted for in the same
manner as operating leases currently are
• onerous lease provisions in existence at the date of initial
adoption will be derecognised and applied against the
corresponding right-of-use asset as a proxy for impairment
• leases of intangible assets such as software licenses will
continue to be accounted for under IAS 38 ‘Intangible Assets’
• where we are lessee in a contract containing both lease
components and non-lease components, we will account for
the arrangement as though it comprises a single lease
component
• initial direct costs will be excluded when measuring the
right-of-use asset
• hindsight will be used when assessing the lease term.
Anticipated impact
BT as lessee
All arrangements previously disclosed as operating lease
commitments will now be recognised on the balance sheet. A key
driver will be group’s portfolio of leased land and buildings, the
majority of which is currently recognised off balance sheet
following a sale and operating leaseback transaction in 2001. Cell
and switch site leases represent another material element, due to
the long lease terms associated with these arrangements.
On the basis of progress made in implementing the standard, we
expect the following impact on adoption:
• lease liabilities of between £5.6bn – £6.6bn will be recognised
as a result of bringing operating lease commitments onto the
balance sheet. Corresponding right-of-use assets will be
recognised, adjusted for accrued lease payments and provisions
currently recognised as liabilities. We do not anticipate a
material impact on retained earnings due to the transition
options selected
• the increase in liabilities will have a corresponding impact on
net debt and gearing ratios
• depreciation expense and interest expense will replace the
current operating lease expense, resulting in increased EBITDA
• profit after tax will see a reduction in the periods immediately
following transition to IFRS 16, driven by interest expense
charged in respect of the new leases being ‘frontloaded’ when
compared to the previous straight-line operating lease expense
• within the cash flow statement, lease payments will now be
presented within cash flows from operating activities and cash
flows from financing activities in respect of depreciation and
interest expense respectively. The timing of cash flows will
remain unchanged.
BT as lessor
Lessor accounting is substantially unchanged under IFRS 16 and
we do not expect the standard to have a material impact on the
accounting for arrangements currently identified as leases.
However, “last mile” arrangements provided by Openreach to
communications providers and currently accounted for as service
contracts meet the revised IFRS 16 lease definition, with
Openreach as lessor.
Connection fees received will now be deferred over the lease
term, which is longer than the current contractual deferral period
as it also covers the duration that we are ‘reasonably certain’ that
communications providers will retain the use of the line beyond
the contractual period. We have determined that this is
six months for all last mile arrangements with the exception of

118
BT Group plc Annual Report 2019
Notes to the consolidated financial statements continued
1. Basis of preparation continued
FTTP, which is unchanged. Additional deferred income will be
recognised in respect of active arrangements at the transition
date, with a corresponding adjustment to retained earnings. This
is not expected to have a material impact on the balance sheet or
income statement.
Other standards
The following standards and interpretations are applicable in
future periods but are not expected to have a significant impact
on the consolidated financial statements.
• IFRIC 23 Uncertainty over Tax Treatments
• IFRS 17 Insurance Contracts
Presentation of specific items
Our income statement and segmental analysis separately identify
trading results before specific items (‘adjusted’). The directors
believe that presentation of our results in this way is relevant to
an understanding of our financial performance, as specific items
are identified by virtue of their size, nature or incidence.
This presentation is consistent with the way that financial
performance is measured by management and reported to the
Board and the
Executive Committee
and assists in providing a
meaningful analysis of our trading results. In determining
whether an event or transaction is specific, management
considers quantitative as well as qualitative factors such as the
frequency or predictability of occurrence.
Furthermore, we consider a columnar presentation to be
appropriate, as it improves the clarity of the presentation and is
consistent with the way that financial performance is measured
by management and reported to the Board and the
Executive Committee.
Specific items may not be comparable to similarly titled measures
used by other companies. Examples of charges or credits meeting
the above definition and which have been presented as specific
items in the current and/or prior years include acquisitions/
disposals of businesses and investments, regulatory settlements,
historical insurance or litigation claims, business restructuring
programmes, asset impairment charges, property rationalisation
programmes, net interest on pensions and the settlement of
multiple tax years. In the event that other items meet the criteria,
which are applied consistently from year to year, they are also
treated as specific items.
Specific items for the current and prior years are disclosed in
note 10.
2. Prior year restatement and opening balance
adjustments
Revision of segment results
During the year we reduced the number of our customer-facing
units with a corresponding impact on reportable segments. Our
BT Consumer and EE customer-facing units were brought
together on 1 April 2018, and our Business and Public Sector and
Wholesale and Ventures customer-facing units were combined on
1 October 2018. The group now has four customer-facing units:
• Consumer (formerly BT Consumer and EE)
• Enterprise (formerly Business and Public Sector and Wholesale
and Ventures)
• Global Services
• Openreach.
During the year we also transferred our Northern Ireland
Networks business from Enterprise to Openreach.
Where appropriate, comparative results for all four
customer-facing units have been revised to be presented on a
consistent basis. This affects the segment information and
employees disclosures. See notes 5 and 8 respectively.
Restatement of previously issued financial statements for
IAS 19 accounting valuation of retirement benefit obligations
On 27 July 2018 we announced that we had been alerted to an
error made by our independent external actuary in the actuary’s
calculation of our IAS 19 accounting valuation of retirement
benefit obligations at 31 March 2018. Our independent external
actuary is employed as an expert to calculate the IAS 19
accounting valuation on behalf of management. The error
resulted from the incorrect application of changes to
demographic assumptions. Management determined that the
error was material with respect to the statement of
comprehensive income and would require us to restate the
previously issued consolidated financial statements for the year
ended 31 March 2018.
The accounting error understated the net pension obligation,
after tax, at 31 March 2018 by £393m (£476m gross of
deferred tax) and overstated total equity in the balance sheet by
£393m. The re-measurement gain of the net pension obligation
recorded within the statement of comprehensive income for the
year ended 31 March 2018 was overstated by £476m and tax
expense on the pension re-measurement was overstated by
£83m.
The error has no effect on the income statement or the cash flow
statement or any amounts included in the financial statements for
the year ending 31 March 2017. It also has no effect on the
2017 triennial funding valuation of the BT Pension Scheme,
associated cash contributions or on the pension scheme members.
Opening balance adjustments resulting from the
implementation of IFRS 15 and IFRS 9
The transition methods we have chosen in applying IFRS 9 and
IFRS 15 mean we do not restate comparative information for the
impact of these standards. We have instead adjusted the 1 April
2018 balance sheet to reflect the impact on opening retained
earnings of recognition of the IFRS 15 contract asset and liability,
and for the IFRS 9 expected loss allowance.
Impact of restatement and opening balance adjustments
Set out below is the impact of these items on the group
statement of comprehensive income and balance sheet. They are
reflected in the group statement of changes in equity as
presented on page 113.

BT Group plc Annual Report 2019
119
Strategic report
Governance
Financial statements
Additional information
2. Prior year restatement and opening balance adjustments continued
Group statement of comprehensive income
Year ended
31 March
2018
(as published)
£m
Pension
restatement
£m
Year ended
31 March
2018
(restated)
£m
Profit for the period 2,032 – 2,032
Other comprehensive income (loss)
Items that will not be reclassified to the income statement:
Remeasurements of the net pension obligation 2,160 (476) 1,684
Tax on pension remeasurements (346) 83 (263)
Items that have been or may be reclassified subsequently to the income statement:
Exchange differences on translation of foreign operations (188) – (188)
Fair value movements on available-for-sale assets 11 – 11
Movements in relation to cash flow hedges: –
net fair value (losses) gains (368) – (368)
recognised in income and expense 277 – 277
Tax on components of other comprehensive income that have been or may be reclassified 1 – 1
Other comprehensive profit (loss) for the period, net of tax 1,547 (393) 1,154
Total comprehensive income (loss) for the period 3,579 (393) 3,186
Group balance sheet
At 31 March
2018
(as published)
£m
Pension
restatement
£m
At 31 March
2018
(restated)
£m
IFRS 9 & 15
opening
balance
adjustment
£m
At 1 April
2018
£m
Non-current assets
Intangible assets 14,447 – 14,447 – 14,447
Property, plant and equipment 17,000 – 17,000 – 17,000
Trade and other receivables 317 – 317 114 431
Contract assets – – – 198 198
Deferred tax assets 1,243 83 1,326 – 1,326
Other non-current assets 1,403 – 1,403 – 1,403
34,410 83 34,493 312 34,805
Current assets
Trade and other receivables 4,014 – 4,014 (337) 3,677
Contract assets – – – 1,417 1,417
Cash and cash equivalents 528 – 528 – 528
Other current assets 3,807 – 3,807 – 3,807
8,349 – 8,349 1,080 9,429
Current liabilities
Loans and other borrowings 2,281 – 2,281 – 2,281
Trade and other payables 7,168 – 7,168 (1,409) 5,759
Contract liabilities – – – 1,406 1,406
Current tax liabilities 83 – 83 248 331
Other current liabilities 653 – 653 – 653
10,185 – 10,185 245 10,430
Total assets less current liabilities 32,574 83 32,657 1,147 33,804
Non-current liabilities
Loans and other borrowings 11,994 – 11,994 – 11,994
Contract liabilities – – – 87 87
Retirement benefit obligations 6,371 476 6,847 – 6,847
Other non-current liabilities 3,905 – 3,905 – 3,905
22,270 476 22,746 87 22,833
Equity
Share capital 499 – 499 – 499
All other reserves 8,046 – 8,046 – 8,046
Retained earnings 1,759 (393) 1,366 1,060 2,426
Total equity 10,304 (393) 9,911 1,060 10,971
32,574 83 32,657 1,147 33,804

120
BT Group plc Annual Report 2019
Notes to the consolidated financial statements continued
3. Critical accounting estimates and key judgements
The preparation of financial statements in conformity with IFRS
requires the use of accounting estimates and assumptions. It also
requires management to exercise its judgement in the process of
applying our accounting policies. We continually evaluate our
estimates, assumptions and judgements based on available
information and experience. As the use of estimates is inherent in
financial reporting, actual results could differ from these
estimates. Management has discussed its critical accounting
estimates and associated disclosures with the
Audit and Risk
Committee
. The areas involving a higher degree of judgement or
complexity are described in the applicable notes to the financial
statements. Critical accounting estimates and key judgements can
be identified throughout the notes by the following symbol
.
We have the following critical accounting estimates (E) and key
judgements (J):
• Current and deferred income tax, see note 11 (E, J).
• Goodwill impairment, see note 14 (E, J).
• Government grants relating to Broadband Delivery UK (BDUK)
contracts, see note 15 (J).
• Provisions and contingent liabilities, see note 19 (E, J).
• Pension obligations, see note 20 (E, J).
4. Significant accounting policies that apply to the
overall financial statements
The significant accounting policies applied in the preparation of
our consolidated financial statements are set out below. Other
significant accounting policies applicable to a particular area are
disclosed in the most relevant note. We have applied all policies
consistently to all the years presented, unless otherwise stated.
Basis of consolidation
The group financial statements consolidate the financial
statements of BT Group plc and its subsidiaries, and include its
share of the results of associates and joint ventures using the
equity method of accounting. The group recognises its direct
rights to (and its share of) jointly held assets, liabilities, revenues
and expenses of joint operations under the appropriate headings
in the consolidated financial statements.
All business combinations are accounted for using the acquisition
method regardless of whether equity instruments or other assets
are acquired. No material acquisitions were made in the year.
A subsidiary is an entity that is controlled by another entity,
known as the parent or investor. An investor controls an investee
when the investor is exposed, or has rights, to variable returns
from its involvement with the investee and has the ability to
affect those returns through its power over the investee.
Non-controlling interests in the net assets of consolidated
subsidiaries, which consist of the amounts of those interests at
the date of the original business combination and non-controlling
share of changes in equity since the date of the combination, are
not material to the group’s financial statements.
The results of subsidiaries acquired or disposed of during the year
are consolidated from and up to the date of change of control.
Where necessary, accounting policies of subsidiaries have been
aligned with the policies adopted by the group. All intra-group
transactions including any gains or losses, balances, income or
expenses are eliminated in full on consolidation.
When the group loses control of a subsidiary, the profit or loss on
disposal is calculated as the difference between (i) the aggregate
of the fair value of the consideration received and the fair value of
any retained interest and (ii) the previous carrying amount of the
assets (including goodwill), and liabilities of the subsidiary and any
non-controlling interests. The profit or loss on disposal is
recognised as a specific item.
Inventories
Network maintenance equipment and equipment to be sold to
customers are stated at the lower of cost or net realisable value,
taking into account expected revenue from the sale of packages
comprising a mobile handset and a subscription. Cost corresponds
to purchase or production cost determined by either the first in
first out (FIFO) or average cost method.
Government grants
Government grants are recognised when there is reasonable
assurance that the conditions associated with the grants have
been complied with and the grants will be received.
Grants for the purchase or production of property, plant and
equipment are deducted from the cost of the related assets and
reduce future depreciation expense accordingly. Grants for the
reimbursement of operating expenditure are deducted from the
related category of costs in the income statement. Estimates and
judgements applied in accounting for government grants received
in respect of the BDUK programme and other rural superfast
broadband contracts are described in note 15.
Once a government grant is recognised, any related deferred
income is treated in accordance with IAS 20 ‘Accounting for
Government Grants and Disclosure of Government Assistance’.
Foreign currencies
Foreign currency transactions are translated into the functional
currency using the exchange rates prevailing at the date of the
transaction. Foreign exchange gains and losses resulting from the
settlement of transactions and the translation of monetary assets
and liabilities denominated in foreign currencies at period end
exchange rates are recognised in the income statement line which
most appropriately reflects the nature of the item or transaction.
On consolidation, assets and liabilities of foreign undertakings are
translated into sterling at year end exchange rates. The results of
foreign undertakings are translated into sterling at average rates
of exchange for the year (unless this average is not a reasonable
approximation of the cumulative effects of the rates prevailing on
the transaction dates, in which case income and expenses are
translated at the dates of the transactions). Foreign exchange
differences arising on the retranslation of foreign undertakings
are recognised directly in a separate component of equity, the
translation reserve.

BT Group plc Annual Report 2019
121
Strategic report
Governance
Financial statements
Additional information
4. Significant accounting policies that apply to the
overall financial statements
continued
In the event of the disposal of an undertaking with assets and
liabilities denominated in a foreign currency, the cumulative
translation difference associated with the undertaking in the
translation reserve is charged or credited to the gain or loss on
disposal recognised in the income statement.
Research and development
Research expenditure is recognised in the income statement in the
period in which it is incurred. Development expenditure, including
the cost of internally developed software, is recognised in the
income statement in the period in which it is incurred unless it is
probable that economic benefits will flow to the group from the
asset being developed, the cost of the asset can be reliably
measured and technical feasibility can be demonstrated, in which
case it is capitalised as an intangible asset on the balance sheet.
Capitalisation ceases when the asset being developed is ready for
use. Research and development costs include direct and indirect
labour, materials and directly attributable overheads.
Leases
Under IAS 17, the determination of whether an arrangement is,
or contains, a lease is based on the substance of the arrangement
and requires an assessment of whether the fulfilment of the
arrangement is dependent on the use of a specific asset or assets
and whether the arrangement conveys the right to use the asset.
Leases of property, plant and equipment where we hold
substantially all the risks and rewards of ownership are classified
as finance leases. Finance lease assets are capitalised at the
commencement of the lease term at the lower of the present
value of the minimum lease payments or the fair value of the
leased asset. The obligations relating to finance leases, net of
finance charges in respect of future periods, are recognised as
liabilities. Leases are subsequently measured at amortised cost
using the effective interest method.
Leases where a significant portion of the risks and rewards are
held by the lessor are classified as operating leases. Rentals are
charged to the income statement on a straight line basis over the
period of the lease.
Termination benefits
Termination benefits (leaver costs) are payable when employment
is terminated before the normal retirement date, or when an
employee accepts voluntary redundancy in exchange for these
benefits. We recognise termination benefits when they are
demonstrably committed to the affected employees leaving
the group.

122
BT Group plc Annual Report 2019
Notes to the consolidated financial statements continued
5. Segment information
Significant accounting policies that apply to segment information
Operating and reportable segments
Our operating segments are reported based on financial information provided to the
Executive Committee,
which is the key management
committee and represents the ‘chief operating decision maker’.
Our organisational structure reflects the different customer groups to which we provide communicationsproductsandservicesviaour
customer-facing units: Consumer, Enterprise, Global Services and Openreach. The customer-facing units are supported by an internal service
unit, Technology, and corporate units including procurement and property management.
The customer-facing units are our reportable segments and generate substantially all of our revenue. Technology and the group’s corporate
units are not reportable segments as they did not meet the quantitative thresholds as set out in IFRS 8 ‘Operating Segments’ for any of the years
presented.
We aggregate the remaining operations and include within the ‘Other’ category to reconcile to the consolidated results of the group. The ‘Other’
category includes unallocated Technology costs and our corporate units.
Allocation of certain items to segments
Provisions for the settlement of significant legal, commercial and regulatory disputes, which are negotiated at a group level, are initially recorded
in the ‘Other’ segment. On resolution of the dispute, the full impact is recognised in the results of the relevant customer-facing unit and offset in
the group results through the utilisation of the provision previously charged to the ‘Other’ segment. Settlements which are particularly
significant or cover more than one financial year may fall within the definition of specific items as detailed in note 10.
The costs incurred by Technology and corporate units are recharged to the customer-facing units to reflect the services it provides to them.
Depreciation and amortisation incurred by Technology in relation to the networks and systems it manages and operates on behalf of the
customer-facing units is allocated to the customer-facing units based on their respective utilisation. Capital expenditure incurred by Technology
for specific projects undertaken on behalf of the customer-facing units is allocated based on the value of the directly attributable expenditure
incurred. Where projects are not directly attributable to a particular customer-facing unit, capital expenditure is allocated between them based
on the proportion of estimated future economic benefits.
Specific items are detailed in note 10 and are not allocated to the reportable segments as this reflects how they are reported to the
Executive
Committee.
Finance expense and income are not allocated to the reportable segments, as the central treasury function manages this activity,
together with the overall net debt position of the group.
Measuring segment performance
Performance of each reportable segment is measured based on adjusted EBITDA. EBITDA is defined as the group profit or loss before interest,
taxation, depreciation and amortisation. Adjusted EBITDA is defined as EBITDA before specific items, net non-interest related finance expense,
and share of profits or losses of associates and joint ventures. Adjusted EBITDA is considered to be a useful measure of the operating
performance of the customer-facing units because it approximates the underlying operating cash flow by eliminating depreciation and
amortisation and also provides a meaningful analysis of trading performance by excluding specific items, which are disclosed separately by virtue
of their size, nature or incidence.
Revenue recognition
Our revenue recognition policy is set out in the following note.
Internal revenue and costs
Most of our internal trading relates to Openreach and arises on rentals, and any associated connection or migration charges, of the UK access
lines and other network products to the customer-facing units, including the use of BT Ireland’s network. This occurs both directly, and also
indirectly, through Technology which is included within the ‘Other’ segment. Enterprise internal revenue arises from Consumer for mobile
Ethernet access and Technology for transmission planning services. Internal revenue arising in Consumer relates primarily to employee
broadband and wi-fi services. Intra-group revenue generated from the sale of regulated products and services is based on market price. Intra-
group revenue from the sale of other products and services is agreed between the relevant customer-facing units and therefore the profitability
of customer-facing units may be impacted by transfer pricing levels.
Geographic segmentation
The UK is our country of domicile and we generate the majority of our revenue from external customers in the UK. The geographic analysis of
revenue is based on the country of origin in which the customer is invoiced. The geographic analysis of non-current assets, which exclude
derivative financial instruments, investments and deferred tax assets, is based on the location of the assets.
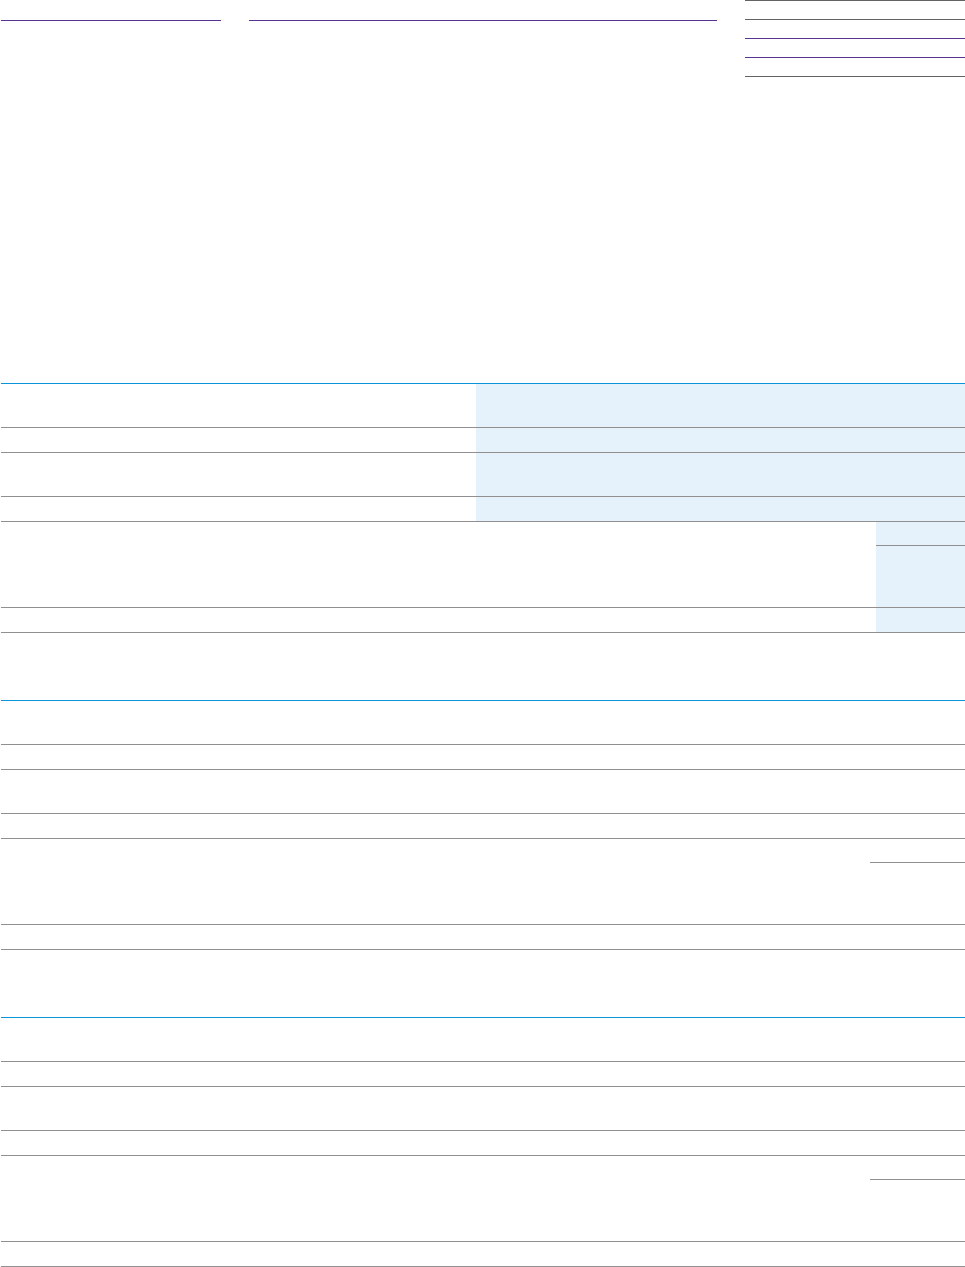
BT Group plc Annual Report 2019
123
Strategic report
Governance
Financial statements
Additional information
5. Segment information continued
Segment revenue and profit
As explained in note 2, our reportable segments changed during the year as a result of a reduction in the number of our customer-
facing units. The BT Consumer and EE segments disclosed in last year’s accounts have been combined into a single reportable segment
named ‘Consumer’, and the Business and Public Sector and Wholesale and Ventures segments now form a single reportable segment,
‘Enterprise’. We also transferred our Northern Ireland Networks business from Enterprise to Openreach and reclassified certain internal
revenues generated by our Ventures businesses as segmental revenue rather than as an internal recovery of cost. The prior year
comparatives presented in this note have been restated to reflect these changes.
Year ended 31 March 2019 (IFRS 15)
Consumer
£m
Enterprise
£m
Global
Services
£m
Openreach
£m
Other
£m
Total
£m
Segment revenue 10,695 6,292 4,735 5,075 3 26,800
Internal revenue (107) (359) – (2,875) – (3,341)
Revenue from external customers
a
10,588 5,933 4,735 2,200 3 23,459
Adjusted EBITDA
b
2,534 1,990 505 2,423 (60) 7,392
Depreciation and amortisation
a
(1,024) (634) (370) (1,468) (50) (3,546)
Operating profit (loss)
a
1,510 1,356 135 955 (110) 3,846
Specific items (note 10) (425)
Operating profit 3,421
Net finance expense
c
(756)
Share of post tax profit (loss) of associates and joint ventures 1
Profit before tax 2,666
Year ended 31 March 2018 (restated) (IAS 18)
Consumer
£m
Enterprise
d
£m
Global
Services
£m
Openreach
d
£m
Other
£m
Total
£m
Segment revenue 10,360 6,647 5,013 5,278 8 27,306
Internal revenue (103) (441) – (3,016) – (3,560)
Revenue from external customers
a
10,257 6,206 5,013 2,262 8 23,746
Adjusted EBITDA
b
2,376 2,077 434 2,615 3 7,505
Depreciation and amortisation
a
(992) (635) (424) (1,401) (62) (3,514)
Operating profit (loss)
a
1,384 1,442 10 1,214 (59) 3,991
Specific items (note 10) (610)
Operating profit 3,381
Net finance expense
c
(764)
Share of post tax profit (loss) of associates and joint ventures (1)
Profit before tax 2,616
Year ended 31 March 2017 (restated) (IAS 18)
Consumer
£m
Enterprise
d
£m
Global
Services
£m
Openreach
d
£m
Other
£m
Total
£m
Segment revenue 10,024 6,975 5,479 5,250 10 27,738
Internal revenue (100) (480) – (3,076) – (3,656)
Revenue from external customers
a
9,924 6,495 5,479 2,174 10 24,082
Adjusted EBITDA
b
2,168 2,261 495 2,734 (13) 7,645
Depreciation and amortisation
a
(989) (613) (439) (1,414) (55) (3,510)
Operating profit (loss)
a
1,179 1,648 56 1,320 (68) 4,135
Specific items (note 10) (968)
Operating profit 3,167
Net finance expense
c
(804)
Share of post tax profit (loss) of associates and joint ventures (9)
Profit before tax 2,354
a
Before specific items.
b
Adjusted EBITDA is defined in the alternative performance measures section on page 185.
c
Net finance expense includes specific item expense of £139m (2017/18: £218m, 2016/17: £210m). See note 10.
d
On 1 October 2018 we transferred our Northern Ireland Networks business from Enterprise to Openreach which resulted in an increase in segment revenue, Adjusted EBITDA and Operating profit in
Openreach of £155m, £95m, and £54m and a decrease in segment revenue, Adjusted EBITDA and Operating profit in Enterprise of £117m, £95m, and £54m for the year ended 31 March 2018 and
an increase in segment revenue, Adjusted EBITDA and Operating profit in Openreach of £152m, £101m, and £56m and a decrease in segment revenue, Adjusted EBITDA and Operating profit in
Enterprise of £112m, £101m, and £56m for the year ended 31 March 2017. Additionally, within the Enterprise segment, we reclassified £224m and £242m of internal revenue generated by our
Ventures businesses as segmental revenue rather than as an internal recovery of cost for the years ended 31 March 2018 and 2017, respectively.

124
BT Group plc Annual Report 2019
Notes to the consolidated financial statements continued
5. Segment information continued
Internal revenue and costs
Internal cost recorded by
Year ended 31 March 2019
Consumer
£m
Enterprise
£m
Global
Services
£m
Openreach
£m
Other
£m
Total
£m
Internal revenue recorded by
Consumer – 69 20 – 18 107
Enterprise 63 – 51 177 68 359
Global Services ––––––
Openreach 920 401 112 – 1,442 2,875
Total 983 470 183 177 1,528 3,341
Internal cost recorded by
Year ended 31 March 2018
Consumer
£m
Enterprise
£m
Global
Services
£m
Openreach
£m
Other
£m
Total
£m
Internal revenue recorded by
Consumer – 65 20 – 18 103
Enterprise
a
130 – 51 173 87 441
Global Services ––––––
Openreach
a
896 480 125 – 1,515 3,016
Total 1,026 545 196 173 1,620 3,560
Internal cost recorded by
Year ended 31 March 2017
Consumer
£m
Enterprise
£m
Global
Services
£m
Openreach
£m
Other
£m
Total
£m
Internal revenue recorded by
Consumer – 62 20 – 18 100
Enterprise
a
148 – 71 165 96 480
Global Services ––––––
Openreach
a
910 536 158 – 1,472 3,076
Total 1,058 598 249 165 1,586 3,656
a
On 1 October 2018 we transferred our Northern Ireland Networks business from Enterprise to Openreach and we reclassified certain internal revenues generated by our Ventures businesses as
segmental revenue rather than an internal recovery of cost. This increases internal revenue recorded by Enterprise by £224m in the year ended 31 March 2018 and £242m in the year ended 31 March
2017. Internal revenue for Openreach has increased by £38m in the year ended 31 March 2018 and £40m in the year ended 31 March 2017.
Capital expenditure
Year ended 31 March 2019
Consumer
£m
Enterprise
£m
Global
Services
£m
Openreach
£m
Other
£m
Total
£m
Intangible assets
a
276 180 93 82 49 680
Property, plant and equipment
b
718 321 152 1,999 93 3,283
Capital expenditure 994 501 245 2,081 142 3,963
Acquisition of spectrum
a
––––304304
Capital expenditure including spectrum 994 501 245 2,081 446 4,267
Year ended 31 March 2018 (restated)
Consumer
£m
Enterprise
£m
Global
Services
£m
Openreach
£m
Other
£m
Total
£m
Intangible assets
a
236 180 92 70 64 642
Property, plant and equipment
b,c
683 312 186 1,629 70 2,880
Capital expenditure 919 492 278 1,699 134 3,522
Year ended 31 March 2017 (restated)
Consumer
£m
Enterprise
£m
Global
Services
£m
Openreach
£m
Other
£m
Total
£m
Intangible assets
a
225 141 126 74 55 621
Property, plant and equipment
b,c
628 313 235 1,546 111 2,833
Capital expenditure 853 454 361 1,620 166 3,454

BT Group plc Annual Report 2019
125
Strategic report
Governance
Financial statements
Additional information
5. Segment information continued
a
Additions to intangible assets as presented in note 14.
b
Additions to property, plant and equipment as presented in note 15, inclusive of movement on engineering stores.
c
On 1 October 2018 we transferred our Northern Ireland Networks business from Enterprise to Openreach. This decreased property, plant and equipment in Enterprise and increased property, plant and
equipment in Openreach by £41m and £47m in the years ended 31 March 2018 and 31 March 2017 respectively.
Geographic segmentation
Revenue from external customers
Year ended 31 March
2019
£m
2018
£m
2017
£m
UK 19,683 19,687 19,421
Europe, Middle East and Africa, excluding the UK 2,280 2,489 2,841
Americas 936 996 1,148
Asia Pacific 560 574 672
Revenue
a
23,459 23,746 24,082
a
Before specific items.
Non-current assets
At 31 March
2019
£m
2018
£m
2017
£m
UK 30,049 28,835 28,810
Europe, Middle East and Africa, excluding the UK 2,217 2,527 2,535
Americas 336 331 424
Asia Pacific 110 109 149
Non-current assets
a
32,712 31,802 31,918
a
Comprising the following balances presented in the group balance sheet: intangible assets; property, plant and equipment; investments in associates and joint ventures; and trade and other receivables.
6. Revenue
We adopted IFRS 15 on 1 April 2018. The impact of initial application of the standard is described in notes 1 and 2.
Significant accounting policies that apply to revenue
On inception of the contract we identify a “performance obligation” for each of the distinct goods or services we have promised to
provide to the customer. The consideration specified in the contract with the customer is allocated to each performance obligation
identified based on their relative standalone selling prices, and is recognised as revenue as they are satisfied.
The table below summarises the performance obligations we have identified for our major service lines and provides information on
the timing of when they are satisfied and the related revenue recognition policy. Also detailed in this note is revenue expected to be
recognised in future periods for contracts in place at 31 March 2019 that contain unsatisfied performance obligations.
Service line Performance obligations Revenue recognition policy
ICT and managed
networks
Provision of networked IT services, managed network
services, and arrangements to design and build
software solutions. Performance obligations are
identified for each distinct service or deliverable for
which the customer has contracted, and are
considered to be satisfied over the time period that
we deliver these services or deliverables.
Commitments to provide hardware to customers that
are distinct from the other promises are considered
to be satisfied at the point in time that control passes
to the customer.
Revenue for services is recognised over time using a
measure of progress that appropriately reflects the
pattern by which the performance obligation is
satisfied. For time and material contracts, revenue
is recognised as the service is received by the
customer. Where performance obligations exist for
the provision of hardware, revenue is recognised at
the point in time that the customer obtains control
of the promised asset. For long-term fixed price
contracts revenue recognition will typically be
based on the achievement of contract milestones
and customer acceptance.

126
BT Group plc Annual Report 2019
Notes to the consolidated financial statements continued
6. Revenue continued
Service line Performance obligations Revenue recognition policy
Fixed access
subscriptions
Provision of broadband, TV and fixed telephony
services including local, national and international
calls, connections, line rental, and calling features.
Performance obligations exist for each ongoing
service provided to the customer and are satisfied
over the period that the services are provided.
Installation services are recognised as distinct
performance obligations if their relationship with the
other services in the contract is purely functional.
These are satisfied when the customer benefits from
the service. Connection services are not distinct
performance obligations and are therefore combined
with the associated service performance obligation.
Fixed subscription charges are recognised as
revenue on a straight line basis over the period that
the services are provided. Upfront charges for
non-distinct connection and installation services are
deferred as contract liabilities and are recognised as
revenue over the same period. Variable charges such
as call charges are recognised when the related
services are delivered. Where installation activities
are distinct performance obligations, revenue is
recognised at the point in time that the installation
is completed.
Mobile
subscriptions
Provision of mobile postpaid and prepaid services,
including voice minutes, SMS, and data services.
Performance obligations exist for each ongoing
service provided to the customer and are satisfied
over the period that the services are provided.
Subscription fees, consisting primarily of monthly
charges for access to broadband and other internet
access or voice and data services, are recognised as
the service is provided. One-off services such as calls
outside of plan and excess data usage are
recognised when the service is used.
Equipment and
other services
Provision of equipment and other services, including
mobile phone handsets and hardware such as set top
boxes and broadband routers provided as part of
customer contracts. Performance obligations are
satisfied at the point in time that control passes to
the customer. For other services, performance
obligations are identified based on the distinct goods
and services we have committed to provide.
Revenue from equipment sales is recognised at the
point in time that control passes to the customer.
Where payment is not received in full at the time of
the sale, such as with equipment provided as part of
mobile and fixed access subscriptions, contract
assets are recognised for the amount due from the
customer that will be recovered over the contract
period. Revenue to be recognised is calculated by
reference to the relative standalone selling price of
the equipment. For other services, revenue is
recognised when the related performance
obligations are satisfied, which could be over time or
at a point in time depending on the nature of the
service.
We recognise revenue based on the relative standalone selling price of each performance obligation. Determining the standalone
selling price often requires judgement and may be derived from regulated prices, list prices, a cost-plus derived price, or the price of
similar products when sold on a standalone basis by BT or a competitor. In some cases it may be appropriate to use the contract price
when this represents a bespoke price that would be the same for a similar customer in a similar circumstance.
The fixed element of fixed access and mobile subscription arrangements sold by our Consumer business is typically payable in
advance, with any variable or one-off charges billed in arrears. Payment is received immediately for direct sales of equipment to
customers. Where equipment is provided to customers under mobile and fixed access subscription arrangements, payment for the
equipment is received over the course of the contract term. For sales by our enterprise businesses, invoices are issued in line with
contractual terms. Payments received in advance are recognised as contract liabilities, amounts billed in arrears are recognised as
contract assets.
We do not have any material obligations in respect of returns, refunds or warranties. Where we act as an agent in a transaction, we
recognise commission net of directly attributable costs. Where the actual and estimated costs to completion of the contract exceed
the estimated revenue, a loss is recognised immediately.
We exercise judgement in assessing whether the initial set-up, transition and transformation phases of long-term contracts are
distinct from the other services to be delivered under the contract and therefore represent distinct performance obligations. This
determines whether revenue is recognised in the early stages of the contract, or deferred until delivery of the other services promised
in the contract begins.

BT Group plc Annual Report 2019
127
Strategic report
Governance
Financial statements
Additional information
6. Revenue continued
We recognise immediately the entire estimated loss for a contract when we have evidence that the contract is unprofitable. If these
estimates indicate that any contract will be less profitable than previously forecast, contract assets may have to be written down to
the extent they are no longer considered to be fully recoverable. We perform ongoing profitability reviews of our contracts in order
to determine whether the latest estimates are appropriate. Key factors reviewed include:
• Transaction volumes or other inputs affecting future revenues which can vary depending on customer requirements, plans, market
position and other factors such as general economic conditions.
• Our ability to achieve key contract milestones connected with the transition, development, transformation and deployment
phases for customer contracts.
• The status of commercial relations with customers and the implications for future revenue and cost projections.
• Our estimates of future staff and third-party costs and the degree to which cost savings and efficiencies are deliverable.
Disaggregation of revenue from contracts with customers
The following table disaggregates revenue from contracts with customers by our major service lines and by reportable segment. The
prior year comparatives have been presented consistent with the presentation in last year’s Annual Report under IAS 18.
Year ended 31 March 2019 (IFRS 15)
Consumer
£m
Enterprise
£m
Global
Services
£m
Openreach
£m
Other
£m
Total
£m
ICT and managed networks – 2,236 2,613 – – 4,849
Fixed access subscriptions 4,564 2,181 362 2,135 – 9,242
Mobile subscriptions 3,866 1,277 130 – – 5,273
Equipment and other services 2,158 239 1,630 65 3 4,095
Revenue before specific items 10,588 5,933 4,735 2,200 3 23,459
Specific items (note 10) (31)
Revenue 23,428
Year ended 31 March (IAS 18)
2018
£m
2017
£m
ICT and managed networks 5,530 5,927
Broadband and TV 4,655 4,477
Mobile 6,451 6,358
Calls, lines and connections 5,126 5,069
Transit 265 404
Other products and services 1,719 1,847
Revenue before specific items 23,746 24,082
Specific items (note 10) (23) (20)
Revenue 23,723 24,062
Revenue expected to be recognised in future periods for performance obligations that are not complete (or are partially complete) as at
31 March 2019 is £14,296m. Of this, £9,425m relates to ICT and managed services contracts and equipment and other services which
will substantially be recognised as revenue within five years. Fixed access and mobile subscription services typically have shorter
contract periods and so £4,871m will substantially be recognised as revenue within two years. Revenue recognised this year relating to
performance obligations that were satisfied, or partially satisfied, in previous years was not material.
Contract assets and liabilities
Significant accounting policies that apply to contract assets and liabilities
We recognise contract assets for goods and services for which control has transferred to the customer before consideration is due.
These assets mainly relate to mobile handsets provided upfront but paid for over the course of a contract. Contract assets are
reclassified as receivables when the right to payment becomes unconditional and we have billed the customer.
Contract liabilities are recognised when we have received advance payment for goods and services that we have not transferred to
the customer. These primarily relate to fees received for connection and installation services that are not distinct performance
obligations.
Where the initial set-up, transition or transformation phase of a long-term contract is considered to be a distinct performance
obligation we recognise a contract asset for any work performed but not billed. Conversely a contract liability is recognised where
these activities are not distinct performance obligations and we receive upfront consideration. In this case eligible costs associated
with delivering these services are capitalised as fulfilment costs, see note 17.
We provide for expected lifetime losses on contract assets following the policy set out in note 17.

128
BT Group plc Annual Report 2019
Notes to the consolidated financial statements continued
6. Revenue continued
Contract assets and liabilities recognised at 31 March 2019 are as follows:
31 March 2019
£m
1 April 2018
£m
Contract assets
Current 1,353 1,417
Non-current 249 198
1,602 1,615
Contract liabilities
Current 1,225 1,406
Non-current 200 87
1,425 1,493
£1,216m of the contract liability recognised at 1 April 2018 was recognised as revenue during the year. Impairment losses of £36m
were recognised on contract assets during the year. Other than business-as-usual movements there were no significant changes in
contract asset and liability balances during the year.
7. Operating costs
Year ended 31 March Notes
2019
£m
2018
£m
2017
£m
Operating costs by nature
Staff costs:
Wages and salaries 4,264 4,229 4,134
Social security costs 440 461 477
Other pension costs 20 611 624 521
Share-based payment expense 22 67 84 57
Total staff costs 5,382 5,398 5,189
Own work capitalised (834) (798) (813)
Net staff costs 4,548 4,600 4,376
Net indirect labour costs
a
267 315 399
Net labour costs 4,815 4,915 4,775
Product costs and sales commissions
b
4,464 4,429 4,588
Payments to telecommunications operators 2,059 2,306 2,653
Property and energy costs 1,325 1,285 1,202
Network operating and IT costs 1,026 963 983
TV programme rights charges 841 763 714
Provision and installation
b
624 657 669
Marketing and sales
b
322 317 365
Other operating costs
b
831 830 675
Other operating income (240) (224) (187)
Depreciation of property, plant and equipment
Owned assets 15 2,390 2,381 2,382
Held under finance leases 15 2 10 10
Amortisation of intangible assets
c
14 1,154 1,123 1,118
Total operating costs before specific items 19,613 19,755 19,947
Specific items 10 394 587 948
Total operating costs 20,007 20,342 20,895
Operating costs before specific items include the following:
Leaver costs
d
17 50 86
Research and development expenditure
e
643 632 638
Operating lease charges 801 732 692
Foreign currency gains (11) 0 (12)
Inventories recognised as an expense 2,388 2,588 2,680
Government grants (3) (3) (5)
a
Net of capitalised indirect labour costs of £672m (2017/18: £612m, 2016/17: £463m).
b
Included within ‘other operating costs’ in prior years were costs relating to product costs and commissions; provision and installation; and marketing and sales. These are now presented separately. The
‘other operating costs’ comparative for 2017/18 and 2016/17 has been re-presented for consistency.
c
Excludes £nil (2017/18: £nil, 2016/17: £62m) of amortisation presented as specific items which relate to a write-off of software costs as a result of the integration of EE.
d
Leaver costs are included within wages and salaries, except for leaver costs of £257m (2017/18: £168m, 2016/17: £37m) associated with restructuring and EE integration costs, which have been
recorded as specific items.
e
Research and development expenditure reported in the income statement includes amortisation of £581m (2017/18: £573m, 2016/17: £577m) in respect of internally developed computer software
and operating expenses of £62m (2017/18: £59m, 2016/17: £61m). In addition, the group capitalised software development costs of £472m (2017/18: £450m, 2016/17: £457m).

BT Group plc Annual Report 2019
129
Strategic report
Governance
Financial statements
Additional information
7. Operating costs continued
Who are our key management personnel and how are they compensated?
Key management personnel comprise executive and non-executive directors and members of the
Executive Committee.
Compensation of key management personnel is shown in the table below:
Year ended 31 March
2019
£m
2018
£m
2017
£m
Short-term employee benefits 13.5 11.8 10.5
Post employment benefits
a
1.2 1.3 1.3
Share-based payments 5.0 6.2 5.6
Termination benefits 0.6 2.2 –
20.3 21.5 17.4
a
Post employment benefits comprise cash pensions allowances paid to the Chief Executive Officer and Chief Financial Officer. The group does not contribute to defined contribution or defined benefit
pension schemes on behalf of key management personnel.
Key management personnel are compensated solely in the form of cash and share-based payments. During the current and prior years,
key management personnel made no gains from exercise of share options.
8. Employees
2019 2018 2017
Number of employees in the group
a
Year end
000
Average
000
Year end
000
Average
000
Year end
000
Average
000
UK 84.3 83.4 82.2 82.5 82.8 82.2
Non-UK 22.4 23.1 23.6 23.7 23.6 22.8
Total employees 106.7 106.5 105.8 106.2 106.4 105.0
As explained in note 2, we reduced the number of our customer-facing units during the year. BT Consumer and EE have been combined
into ‘Consumer’, and Business and Public Sector and Wholesale and Ventures have been combined into ‘Enterprise’. We also transferred
c700 employees in our Northern Ireland Networks business from Enterprise to Openreach. The prior year comparatives presented in the
table below have been restated to reflect these changes.
2019 2018 2017
Number of employees in the group
a
Year end
000
Average
000
Year end
000
Average
000
Year end
000
Average
000
Consumer 19.7 19.0 18.2 18.0 17.9 16.8
Enterprise
b
13.4 13.8 13.2 13.5 13.4 13.2
Global Services 16.6 16.8 16.9 17.3 17.5 17.4
Openreach
b
33.2 31.9 31.2 31.1 30.9 31.6
Other 23.8 25.0 26.3 26.3 26.7 26.0
Total employees 106.7 106.5 105.8 106.2 106.4 105.0
a
These reflect the full-time equivalent of full and part-time employees.
b
The 2018 and 2017 comparatives have been restated to reflect the change in segments and the transfer of Northern Ireland Networks as described above.

130
BT Group plc Annual Report 2019
Notes to the consolidated financial statements continued
9. Audit, audit related and other non-audit services
The following fees were paid or are payable to the company’s auditors, KPMG LLP and other firms in the KPMG network, for the year
ended 31 March 2019. Figures in the table below for the years ended 31 March 2017 and 2018 are in respect of fees paid to the
company’s previous auditors, PricewaterhouseCoopers LLP.
Year ended 31 March
2019
£000
2018
£000
2017
£000
Fees payable to the company’s auditors and its associates for:
Audit services
a,b
The audit of the parent company and the consolidated financial statements 8,165 5,418 4,316
The audit of the company’s subsidiaries 6,061 5,877 5,675
14,226 11,295 9,991
Audit related assurance services
c
2,236 1,771 1,865
Other non-audit services
Taxation compliance services
d
– – 366
Taxation advisory services
e
– – 111
All other assurance services
f
748 211 200
All other services
g
210 592 2,332
958 803 3,009
Total services 17,420 13,869 14,865
a
Services in relation to the audit of the parent company and the consolidated financial statements, including fees for reports under section 404 of the Sarbanes-Oxley Act. This also includes fees payable
for the statutory audits of the financial statements of subsidiary companies. This excludes amounts for the audit of BT Group Employee Share Ownership Trust and Ilford Trustees (Jersey) Limited
amounting to £32,000.
b
During the year a further £446,000 of fees were payable to PricewaterhouseCoopers LLP in relation to the audit of 2017/18 subsidiary accounts and the audit of our restated IAS 19 accounting
valuation of retirement benefit obligations, which have not been included in the 2019 balances in the above table.
c
Services in relation to other statutory filings or engagements that are required by law or regulation to be carried out by an appointed auditor. This includes fees for the review of interim results, the
accrued fee for the audit of the group’s regulatory financial statements and reporting associated with the group’s US debt shelf registration.
d
Services relating to tax returns, tax audits, monitoring and enquiries.
e
Fees payable for all taxation advisory services not falling within taxation compliance.
f
All other assurance services include fees payable to KPMG LLP for agreed upon procedures performed on the estimated impact of the new IFRS 15 revenue accounting standard, which took effect from
1 April 2018 for the 2017/18 audit.
g
Fees payable for all non-audit services not covered above, principally comprising other advisory services.
The BT Pension Scheme is an associated pension fund as defined in the Companies (Disclosure of Auditor Remuneration and Liability
Limitation Agreements) (Amendment) Regulations 2011. In the year ended 31 March 2019 KPMG LLP received total fees from the BT
Pension Scheme of £1.1m (PricewaterhouseCoopers LLP: 2017/18: £2.1m, 2016/17: £2.1m) in respect of the following services:
Year ended 31 March
2019
£000
2018
£000
2017
£000
Audit of financial statements of associates 1,005 345 251
Audit-related assurance services 53 – –
Taxation compliance services – 153 210
Taxation advisory services – 1,074 493
Other non-audit services 62 565 1,168
Total services 1,120 2,137 2,122
10. Specific items
Significant accounting policies that apply to specific items
We separately identify and disclose those items that in management’s judgement need to be disclosed by virtue of their size, nature
or incidence (termed ‘specific items’). Specific items are used to derive the adjusted results as presented in the consolidated income
statement presented on page 110. Adjusted results are consistent with the way that financial performance is measured by
management and assists in providing an additional analysis of the reporting trading results of the group. Specific items may not be
comparable to similarly titled measures used by other companies.
In determining whether an event or transaction is specific, management considers quantitative as well as qualitative factors.
Examples of charges or credits meeting the above definition and which have been presented as specific items in the current and/or
prior years include acquisitions/disposals of businesses and investments, retrospective regulatory matters, historical insurance or
litigation claims, business restructuring programmes, asset impairment charges, property rationalisation programmes, net interest on
pensions and the settlement of multiple tax years. In the event that items meet the criteria, which are applied consistently from year
to year, they are treated as specific items.

BT Group plc Annual Report 2019
131
Strategic report
Governance
Financial statements
Additional information
10. Specific items continued
Year ended 31 March
2019
£m
2018
£m
2017
£m
Revenue
Italian business investigation ––22
Retrospective regulatory matters 31 23 (2)
31 23 20
Operating costs
EE acquisition warranty claims – 225 –
Restructuring charges 386 241 –
EE integration costs – 46 215
Property rationalisation costs 36 28 –
Pension equalisation costs 26 – –
Retrospective regulatory matters (4) 26 481
Italian business investigation (55) 22 238
Out of period irrecoverable VAT ––30
Profit (loss) on disposal of businesses 5 (1) (16)
394 587 948
Operating loss 425 610 968
Net finance expense
Interest expense on retirement benefit obligation 139 218 209
Interest on out of period irrecoverable VAT – – 1
139 218 210
Net specific items charge before tax 564 828 1,178
Taxation
Tax credit on specific items above (112) (87) (154)
Tax credit on re-measurement of deferred tax – – (63)
(112) (87) (217)
Net specific items charge after tax 452 741 961
Restructuring charges
During the year we incurred charges of £386m (2017/18: £241m, 2016/17: £nil), primarily relating to leaver costs. These costs
reflect projects within our group-wide cost transformation programme and include costs related to the remaining integration of EE and
£23m costs to close the BT Pension Scheme and provide transition payments to affected employees.
EE integration costs
EE integration costs incurred in prior years (2017/18: £46m, 2016/17: £215m) relate to EE related restructuring and leaver costs. In
2016/17, this also included a £62m amortisation charge relating to the write-off of IT assets as we integrated the EE and BT IT
infrastructure. In the current year remaining EE integration activities have been combined into the wider restructuring programme.
Retrospective regulatory matters
We have recognised a net charge of £27m (2017/18: £49m, 2016/17: £479m) in relation to regulatory matters in the year. This
reflects the completion of the majority of compensation payments to other communications providers in relation to Ofcom’s March
2017 findings of its investigation into our historical practices on Deemed Consent by Openreach, and new matters arising. Of this,
£31m is recognised in revenue offset by £4m in operating costs.
Pension equalisation costs
During the year we recognised a charge of £26m (2017/18: £nil, 2016/17: £nil) in relation to the high court requirement to equalise
pension benefits between men and women due to guaranteed minimum pension (GMP).
Property rationalisation costs
We have recognised a charge of £36m (2017/18: £28m, 2016/17: £nil) relating to the rationalisation of the group’s property
portfolio and a reassessment of lease-end obligations.
Italian business investigation
During the year we have released £(55)m provisions relating to settlement of various matters in our Italian business (2017/18: a charge
of £22m, 2016/17: a charge of £238m).
Interest expense on retirement benefit obligation
During the year we incurred £139m (2017/18: £218m, 2016/17: 209m) of interest costs in relation to our defined benefit pension
obligations. See note 20 for more details.
Tax on specific items
A tax credit of £112m (2017/18: £87m, 2016/17: 154m) was recognised in relation to specific items.

132
BT Group plc Annual Report 2019
Notes to the consolidated financial statements continued
10. Specific items continued
EE acquisition warranty claims
In the prior year we reached settlements with Deutsche Telekom and Orange in respect of any warranty claims under the 2015 EE
acquisition agreement, arising from the issues previously announced regarding our operations in Italy. This represents a full and final
settlement of these issues and resulted in a specific item charge of £225m.
11. Taxation
Significant accounting policies that apply to taxation
Current income tax is calculated on the basis of the tax laws enacted or substantively enacted at the balance sheet date in the
countries where the group’s subsidiaries, associates and joint ventures operate and generate taxable income. We periodically
evaluate positions taken in tax returns with respect to situations in which applicable tax regulation is subject to interpretation, and
establish provisions where appropriate on the basis of the amounts expected to be paid to tax authorities.
Deferred tax is recognised, using the liability method, in respect of temporary differences between the carrying amount of our assets
and liabilities and their tax base. Deferred tax is determined using tax rates that are expected to apply in the periods in which the
asset is realised or liability settled, based on tax rates and laws that have been enacted or substantively enacted by the balance sheet
date.
Deferred income tax assets and liabilities are offset when there is a legally enforceable right to offset current tax assets against
current tax liabilities and when the deferred income tax assets and liabilities relate to income taxes levied by the same taxation
authority on either the taxable entity or different taxable entities where there is an intention to settle the balances on a net basis.
Any remaining deferred tax asset is recognised only when, on the basis of all available evidence, it can be regarded as probable that
there will be suitable taxable profits, within the same jurisdiction, in the foreseeable future against which the deductible temporary
difference can be utilised. Deferred tax balances for which there is a right of offset within the same jurisdiction are presented net on
the face of the group balance sheet as permitted by IAS 12, with the exception of deferred tax related to our pension schemes which
is disclosed within deferred tax assets.
Critical accounting judgements and key estimates made in accounting for taxation
We seek to pay tax in accordance with the laws of the countries where we do business. However, in some areas these laws are
unclear, and it can take many years to agree an outcome with a tax authority or through litigation. We estimate our tax on
country-by-country and issue-by-issue bases. Our key uncertainties are whether EE’s tax losses will be available to us, whether our
intra-group trading model will be accepted by a particular tax authority and whether intra-group payments are subject to
withholding taxes. We provide for the most likely outcome where an outflow is probable, but the agreed amount can differ materially
from our estimates. Approximately 85% by value of the provisions are under active tax authority examination and are therefore
likely to be re-estimated or resolved in the coming 12 months. £252m (2017/18: £240m) is included in current tax liabilities in
relation to these uncertainties.
Under a downside case an additional amount of £556m could be required to be paid, of which £474m would relate to EE losses. This
amount is not provided as we don’t consider this outcome to be probable.
Deciding whether to recognise deferred tax assets is judgemental. We only recognise them when we consider it is probable that they
can be recovered. In making this judgement we consider evidence such as historical financial performance, future financial plans and
trends, the duration of existing customer contracts and whether our intra-group pricing model has been agreed by the relevant tax
authority.
The value of the group’s income tax assets and liabilities is disclosed on the group balance sheet on page 112. The value of the
group’s deferred tax assets and liabilities is disclosed below.

BT Group plc Annual Report 2019
133
Strategic report
Governance
Financial statements
Additional information
11. Taxation continued
Analysis of our taxation expense for the year
Year ended 31 March
2019
£m
2018
£m
2017
£m
United Kingdom
Corporation tax at 19% (2017/18: 19%, 2016/17: 20%) (434) (578) (555)
Adjustments in respect of earlier years (9) 37 33
Non-UK taxation
Current (74) (66) (109)
Adjustments in respect of earlier years 15 23 –
Total current tax expense (502) (584) (631)
Deferred taxation
Origination and reversal of temporary differences (20) 46 96
Adjustments in respect of earlier years 2 (57) 26
Impact of change in UK corporation tax rate to 17% (2017/18: 17%, 2016/17: 17%) – – 63
Remeasurement of temporary differences 13 11 –
Total deferred taxation (expense) credit (5) – 185
Total taxation expense (507) (584) (446)
Factors affecting our taxation expense for the year
The taxation expense on the profit for the year differs from the amount computed by applying the UK corporation tax rate to the profit
before taxation as a result of the following factors:
Year ended 31 March
2019
£m
2018
£m
2017
£m
Profit before taxation 2,666 2,616 2,354
Expected taxation expense at UK rate of 19% (2017/18: 19%, 2016/17: 20%) (506) (497) (471)
Effects of:
(Higher) lower taxes on non-UK profits (7) (8) (29)
Net permanent differences between tax and accounting
a
(36) (100) (183)
Adjustments in respect of earlier years
b
8359
Prior year non-UK losses used against current year profits 21 16 120
Non-UK losses not recognised
c
– (9) (8)
Other deferred tax assets not recognised –––
Lower taxes on profit on disposal of business – – 3
Re-measurement of deferred tax balances 13 11 63
Other non-recurring items –––
Total taxation expense (507) (584) (446)
Exclude specific items (note 10) (112) (87) (217)
Total taxation expense before specific items (619) (671) (663)
a
Includes income that is not taxable or UK income taxable at a different rate, and expenses for which no tax relief is received. Examples include some types of depreciation and amortisation and the
benefit of R&D tax incentives.
b
Reflects the differences between initial accounting estimates and tax returns submitted to tax authorities, including the release and establishment of provisions for uncertain tax positions.
c
Reflects losses made in countries where it has not been considered appropriate to recognise a deferred tax asset, as future taxable profits are not probable.
Tax components of other comprehensive income
Year ended 31 March
2019
Tax credit
(expense)
£m
2018
Tax credit
(expense)
(Restated)
£m
2017
Tax credit
(expense)
£m
Tax on items that will not be reclassified to the income statement
Pension remeasurements
a
384 (263) 416
Tax on items that have been or may be reclassified subsequently to the income statement
Exchange differences on translation of foreign operations (4) (9) 21
Fair value movements on cash flow hedges
net fair value gains or losses (37) 57 (131)
recognised in income and expense – (47) 139
343 (262) 445
Current tax credit
b
395 203 122
Deferred tax (expense) credit (52) (465) 323
343 (262) 445
a
Certain results have been restated to reflect the update to the calculation of our IAS 19 accounting valuation of retirement benefit obligations. See note 2.
b
Includes £391m (2017/18: £212m, 2016/17: £110m) relating to cash contributions made to reduce retirement benefit obligations.

134
BT Group plc Annual Report 2019
Notes to the consolidated financial statements continued
11. Taxation continued
Tax (expense) credit recognised directly in equity
Year ended 31 March
2019
£m
2018
£m
2017
£m
Tax (expense) credit relating to share-based payments – (2) (6)
Deferred taxation
Fixed asset
temporary
differences
£m
Retirement
benefit
obligations
b
£m
Share-
based
payments
£m
Tax
losses
£m
Other
£m
Jurisdictional
offset
£m
Total
(Restated)
£m
At 1 April 2017 1,432 (1,537) (17) (270) (85) – (477)
Expense (credit) recognised in the income statement 11 (104) 4 89 – – –
Expense (credit) recognised in other comprehensive
income (restated)
a
– 475 – – (10) – 465
Expense (credit) recognised in equity – – 6–––6
Exchange differences – – – (2) 5 – 3
Transfer to current tax 17–––––17
At 31 March 2018 1,460 (1,166) (7) (183) (90) – 14
Non-current
Deferred tax asset (41) (1,166) (7) (183) (90) 161 (1,326)
Deferred tax liability 1,501 ––––(161) 1,340
At 1 April 2018 1,460 (1,166) (7) (183) (90) – 14
Expense (credit) recognised in the income statement (60) (59) 1 114 (1) – (5)
Expense (credit) recognised in other comprehensive
income – 15 – – 37 – 52
Expense (credit) recognised in equity – – (1) – – – (1)
Exchange differences – – 1 (1) – – –
At 31 March 2019 1,400 (1,210) (6) (70) (54) – 60
Non-current
Deferred tax asset (27) (1,210) (6) (70) (54) 20 (1,347)
Deferred tax liability 1,427 ––––(20) 1,407
At 31 March 2019 1,400 (1,210) (6) (70) (54) – 60
a
Certain results have been restated to reflect the update to the calculation of our IAS 19 accounting valuation of retirement benefit obligations. See note 2.
b
Includes a deferred tax asset of £2m (2017/18: £2m) arising on contributions payable to defined contribution pension plans.
The majority of the deferred tax assets and liabilities noted above are anticipated to be realised after more than 12 months.
What factors affect our future tax charges?
The rate of UK corporation tax will change from 19% to 17% on 1 April 2020. As deferred tax assets and liabilities are measured at the
rates that are expected to apply in the periods of the reversal, deferred tax balances at 31 March 2019 have been calculated at the rate
at which the relevant balance is expected to be recovered or settled.
What are our unrecognised tax losses and other temporary differences?
At 31 March 2019 we had operating losses and other temporary differences carried forward in respect of which no deferred tax assets
were recognised amounting to £4.2bn (2017/18: £4.1bn). Our other temporary differences have no expiry date restrictions. The
expiry date of operating losses carried forward is dependent upon the tax law of the various territories in which the losses arose.
A summary of expiry dates for losses in respect of which restrictions apply is set out below:
At 31 March 2019 £m Expiry
Restricted losses
Europe 16 2019–2038
Americas 205 2019–2038
Other 3 2019–2038
Total restricted losses 224
Unrestricted operating losses 3,905 No expiry
Other temporary differences 108 No expiry
Total 4,237

BT Group plc Annual Report 2019
135
Strategic report
Governance
Financial statements
Additional information
11. Taxation continued
At 31 March 2019 we had UK capital losses carried forward in respect of which no deferred tax assets were recognised amounting to
£16.9bn (2017/18: £16.9bn). These losses have no expiry date, but we consider the future utilisation of significant amounts of these
losses to be remote.
At 31 March 2019 the undistributed earnings of non-UK subsidiaries were £2.5bn (2017/18: £2.4bn). No deferred tax liabilities have
been recognised in respect of these unremitted earnings because the group is in a position to control the timing of any dividends from
subsidiaries and hence any tax consequences that may arise. Under current tax rules, tax of £18.2m (2017/18: £23.0m) would arise if
these earnings were to be repatriated to the UK. On 29 March 2017, the UK Government notified the EU of its intention to withdraw
membership from the EU. Depending on the outcome of negotiations we could cease to benefit from the EU Parent Subsidiary directive
on dividends paid by our EU subsidiaries. In this event, additional tax of up to £27.5m could arise if the undistributed earnings of EU
subsidiaries of £970m were to be repatriated to the UK.
12. Earnings per share
How are earnings per share calculated?
Basic earnings per share is calculated by dividing the profit after tax attributable to equity shareholders by the weighted average
number of shares in issue after deducting the own shares held by employee share ownership trusts and treasury shares.
In calculating the diluted earnings per share, share options outstanding and other potential shares have been taken into account where
the impact of these is dilutive. Options over 36m shares (2017/18: 23m shares, 2016/17: 27m shares) were excluded from the
calculation of the total diluted number of shares as the impact of these is antidilutive.
Year ended 31 March 2019 2018 2017
Basic weighted average number of shares (millions) 9,912 9,911 9,938
Dilutive shares from share options (millions) 6 2 27
Dilutive shares from executive share awards (millions) 57 48 29
Diluted weighted average number of shares (millions) 9,975 9,961 9,994
Basic earnings per share 21.8p 20.5p 19.2p
Diluted earnings per share 21.6p 20.4p 19.1p
The earnings per share calculations are based on profit after tax attributable to equity shareholders of the parent company which
excludes non-controlling interests. Profit after tax was £2,159m (2017/18: £2,032m, 2016/17: £1,908m) and profit after tax
attributable to non-controlling interests was £3m (2017/18: £4m, 2016/17: £1m). Profit attributable to non-controlling interests is
not presented separately in the financial statements as it is not material.
13. Dividends
What dividends have been paid and proposed for the year?
The Board recommends that a final dividend in respect of the year ended 31 March 2019 of 10.78p per share will be paid to
shareholders on 9 September 2019 (2017/18: 10.55p paid to shareholders on 3 September), taking the full year proposed dividend
per share in respect of 2018/19 to 15.4p (2017/18: 15.4p, 2016/17: 15.4p) which amounts to approximately £1,527m (2017/18:
£1,524m, 2016/17: £1,532m). This final dividend is subject to approval by shareholders at the Annual General Meeting and therefore
the liability of approximately £1,069m (2017/18: £1,044m, 2016/17: £1,050m) has not been included in these financial
statements. The proposed dividend will be payable to all shareholders on the Register of Members on 9 August 2019. The election date
for participation in BT’s Dividend Investment Plan in respect of this dividend is 23 August 2019.
The amount of £1,503m (2017/18: £1,524m, 2015/16: £1,436m) for the final and interim dividends is disclosed in our statement of
changes in equity and analysed below. This value may differ from the amount shown for equity dividends paid in the group cash flow
statement, which represents the actual cash paid in relation to dividend cheques that have been presented over the course of the
financial year.
2019 2018 2017
Year ended 31 March
pence
per share £m
pence
per share £m
pence
per share £m
Final dividend in respect of the prior year 10.55 1,045 10.55 1,044 9.60 954
Interim dividend in respect of the current year 4.62 458 4.85 480 4.85 482
15.17 1,503 15.40 1,524 14.45 1,436

136
BT Group plc Annual Report 2019
Notes to the consolidated financial statements continued
14. Intangible assets
Significant accounting policies that apply to intangible assets
We recognise identifiable intangible assets where we control the asset, it is probable that future economic benefits attributable to
the asset will flow to the group, and we can reliably measure the cost of the asset. We amortise all intangible assets, other than
goodwill, over their useful economic life. The method of amortisation reflects the pattern in which the assets are expected to be
consumed. If the pattern cannot be determined reliably, the straight line method is used.
Goodwill
Goodwill represents the excess of the cost of an acquisition over the fair value of the group’s share of the identifiable net assets
(including intangible assets) of the acquired business. Our goodwill impairment policy is set out later in this note.
Acquired intangible assets – customer relationships and brands
Intangible assets such as customer relationships or brands acquired through business combinations are recorded at fair value at the
date of acquisition and subsequently carried at amortised cost. Assumptions are used in estimating the fair values of these
relationships or brands and include management’s estimates of revenue and profits to be generated by them.
Telecommunications licences
Licence fees paid to governments, which permit telecommunications activities to be operated for defined periods, are initially
recorded at cost and amortised from the time the network is available for use to the end of the licence period or where our usage
can extend beyond the initial licence period, over the period we expect to benefit from the use of the licences, which is typically
20 years. Licences acquired through business combinations are recorded at fair value at the date of acquisition and subsequently
carried at amortised cost. The fair value is based on management’s assumption of future cash flows using market
expectations at acquisition date.
Computer software
Computer software comprises computer software licences purchased from third parties, and also the cost of internally developed
software. Computer software licences purchased from third parties are initially recorded at cost. We only capitalise costs directly
associated with the production of internally developed software, including direct and indirect labour costs of development, where it
is probable that the software will generate future economic benefits, the cost of the asset can be reliably measured and technical
feasibility can be demonstrated, in which case it is capitalised as an intangible asset on the balance sheet. Costs which do not meet
these criteria and research costs are expensed as incurred.
Our development costs which give rise to internally developed software include upgrading the network architecture or functionality
and developing service platforms aimed at offering new services to our customers.
Other
Other intangible assets include website development costs and other licences. Items are capitalised at cost and amortised on a
straight line basis over their useful economic life or the term of the contract.
Estimated useful economic lives
The estimated useful economic lives assigned to the principal categories of intangible assets are as follows:
• Computer software 2 to 10 years
• Telecommunications licences 2 to 20 years
• Customer relationships and brands 1 to 15 years
Impairment of intangible assets
Intangible assets with finite useful lives are tested for impairment if events or changes in circumstances (assessed at each reporting
date) indicate that the carrying amount may not be recoverable. When an impairment test is performed, the recoverable amount is
assessed by reference to the higher of the net present value of the expected future cash flows (value in use) of the relevant cash
generating unit and the fair value less costs to dispose.
Goodwill is reviewed for impairment at least annually as described below. Impairment losses are recognised in the income statement,
as a specific item. If a cash generating unit is impaired, impairment losses are allocated firstly against goodwill, and secondly on a
pro-rata basis against intangible and other assets.

BT Group plc Annual Report 2019
137
Strategic report
Governance
Financial statements
Additional information
14. Intangible assets continued
Goodwill
£m
Customer
relationships
and brands
£m
Telecoms
licences
and other
£m
Internally
developed
software
£m
Purchased
software
£m
Total
£m
Cost
At 1 April 2017 8,034 3,422 2,945 4,363 1,853 20,617
Additions – – – 517 125 642
Acquisitions 14 – 3 – – 17
Disposals and adjustments
a
(3) – (3) (55) (413) (474)
Exchange differences (100) (12) 6 (3) 9 (100)
At 31 March 2018 7,945 3,410 2,951 4,822 1,574 20,702
Additions – – 304 520 160 984
Disposals and adjustments
a
(2) – (3) (945) (141) (1,091)
Transfers – – 4 120 (80) 44
Exchange differences 63 7 (4) 1 (8) 59
At 31 March 2019 8,006 3,417 3,252 4,518 1,505 20,698
Accumulated amortisation
At 1 April 2017 – 813 280 3,193 1,302 5,588
Charge for the year – 379 141 525 78 1,123
Disposals and adjustments
a
– – (3) (36) (426) (465)
Exchange differences – (1) 3 (2) 9 9
At 31 March 2018 – 1,191 421 3,680 963 6,255
Charge for the year – 377 142 525 110 1,154
Disposals and adjustments
a
– – (3) (941) (147) (1,091)
Transfers – – 3 (43) 43 3
Exchange differences – 3 (3) – (8) (8)
At 31 March 2019 – 1,571 560 3,221 961 6,313
Carrying amount
At 31 March 2019 8,006 1,846 2,692 1,297 544 14,385
At 31 March 2018 7,945 2,219 2,530 1,142 611 14,447
a
Fully depreciated assets in the group’s fixed asset registers were reviewed during the year, as part of the group’s annual asset verification exercise, and certain assets that were no longer in use have been
written off, reducing cost and accumulated depreciation by £1.0bn (2017/18: £0.4bn).
Impairment of goodwill
Significant accounting policies that apply to impairment of goodwill
We perform an annual goodwill impairment review.
Goodwill recognised in a business combination does not generate cash flows independently of other assets or groups of assets. As a
result, the recoverable amount, being the value in use, is determined at a cash generating unit (CGU) level. These CGUs represent the
smallest identifiable groups of assets that generate cash inflows that are largely independent of the cash inflows from other groups
of assets. Our CGUs are deemed to be legacy BT Consumer, legacy EE, Enterprise, and Global Services.
We allocate goodwill to each of the Cash Generating Units (CGUs) that we expect to benefit from the business combination. Each CGU
to which goodwill is allocated represents the lowest level within the group at which the goodwill is monitored for internal
management purposes.
The value in use of each CGU is determined using cash flow projections derived from financial plans approved by the Board covering a
five-year period. They reflect management’s expectations of revenue, EBITDA growth, capital expenditure, working capital and
operating cash flows, based on past experience and future expectations of business performance. Cash flows beyond the fifth year
have been extrapolated using perpetuity growth rates.
Critical accounting estimates and key judgements made in reviewing goodwill for impairment
Determining our CGUs
The determination of our CGUs is judgemental. The identification of CGUs involves an assessment of whether the asset or group of
assets generate largely independent cash inflows. This involves consideration of how our core assets are operated and whether these
generate independent revenue streams. During the year we reviewed our CGUs and have brought together Business and Public
Sector and Wholesale and Ventures into ‘Enterprise’, aligning our CGUs to our customer-facing units. The legacy BT Consumer and
EE CGUs remain as two separate CGUs due to their having independent cash flows.

138
BT Group plc Annual Report 2019
Notes to the consolidated financial statements continued
14. Intangible assets continued
Estimating value in use
Our value in use calculations require estimates in relation to uncertain items, including management’s expectations of future revenue
growth, operating costs, profit margins, operating cash flows, and the discount rate for each CGU. Future cash flows used in the value
in use calculations are based on our latest Board-approved five-year financial plans. Expectations about future growth reflect the
expectations of growth in the markets to which the CGU relates. The future cash flows are discounted using a pre-tax discount rate
that reflects current market assessments of the time value of money. The discount rate used in each CGU is adjusted for the risk
specific to the asset, including the countries in which cash flow will be generated, for which the future cash flow estimates have not
been adjusted.
We tested our goodwill for impairment as at 31 December 2018. The carrying value of goodwill and the key assumptions used in
performing the annual impairment assessment and sensitivities are disclosed below.
Cost
Legacy BT
Consumer
£m
Legacy EE
£m
Enterprise
£m
Business and
Public Sector
Wholesale and
Ventures
Global
Services
£m
Total
£m
At 1 April 2017 1,183 2,768 – 2,570 942 571 8,034
Exchange differences – – – (8) – (92) (100)
Acquisitions and disposals – – – – – 11 11
At 31 March 2018 1,183 2,768 – 2,562 942 490 7,945
Transfer – – 3,504 (2,562) (942) – –
Exchange differences – – 5 – – 58 63
Acquisitions and disposals – – – – – (2) (2)
At 31 March 2019 1,183 2,768 3,509 – – 546 8,006
What discount rate have we used?
The pre-tax discount rates applied to the cash flow forecasts are derived from our post-tax weighted average cost of capital. The
assumptions used in the calculation of the group’s weighted average cost of capital are benchmarked to externally available data. The
pre-tax discount rate used in performing the value in use calculation in 2018/19 was 8.2% (2017/18: 8.4%). We’ve used the same
discount rate for all CGUs except Global Services where we have used 8.7% (2017/18: 8.8%) reflecting higher risk in some of the
countries in which Global Services operates.
What growth rates have we used?
The perpetuity growth rates are determined based on the forecast market growth rates of the regions in which the CGU operates, and
they reflect an assessment of the long-term growth prospects of that market. The growth rates have been benchmarked against
external data for the relevant markets. None of the growth rates applied exceed the expected long-term average growth rates for those
markets or sectors. We used a perpetuity growth rate of 2.4% (2017/18: 2.3%) for Global Services and 2.0% (2017/18: 2.0%) for
Enterprise and our legacy BT Consumer and EE CGUs.
What sensitivities have we applied?
There is significant headroom in our Enterprise and legacy BT Consumer and EE CGUs. For Global Services, the value in use exceeds the
carrying value of the CGU by approximately £1,198m (2017/18: £776m). Any of the following changes in assumptions in isolation
would cause the recoverable amount for the CGU to equal its carrying amount:
• a reduction in the perpetuity growth rate from our 2.4% assumption to a revised assumption of a perpetuity decline rate of 4.1%;
• an increase in the discount rate from our 8.7% assumption to a revised assumption of 13.6%; or
• shortfalls in trading performance against forecast resulting in operating cash flows decreasing by 42% each year and in perpetuity.
15. Property, plant and equipment
Significant accounting policies that apply property, plant and equipment
Our property, plant and equipment is included at historical cost, net of accumulated depreciation, government grants and any
impairment charges. Property, plant and equipment acquired through business combinations are initially recorded at fair value and
subsequently accounted for on the same basis as our existing assets. We derecognise items of property, plant and equipment on
disposal or when no future economic benefits are expected to arise from the continued use of the asset. The difference between the
sale proceeds and the net book value at the date of disposal is recognised in operating costs in the income statement.
Included within the cost of network infrastructure and equipment are direct and indirect labour costs, materials and directly
attributable overheads.

BT Group plc Annual Report 2019
139
Strategic report
Governance
Financial statements
Additional information
15. Property, plant and equipment continued
We depreciate property, plant and equipment on a straight line basis from the time the asset is available for use, to write off the
asset’s cost over the estimated useful life taking into account any expected residual value. Freehold land is not depreciated.
Estimated useful economic lives
The estimated useful lives assigned to principal categories of assets are as follows:
Land and buildings
• Freehold buildings 14 to 50 years
• Short-term leasehold improvements Shorter of 10 years or lease term
• Leasehold land and buildings Unexpired portion of lease or 40 years, whichever is the shorter
Network infrastructure
Transmission equipment
• Duct 40 years
• Cable 3 to 25 years
• Fibre 5 to 20 years
Exchange equipment 2 to 13 years
Other network equipment 2 to 20 years
Other assets
• Motor vehicles 2 to 9 years
• Computers and office equipment 3 to 7 years
Assets held under finance leases are depreciated over the shorter of the lease term or their useful economic life. Residual values and
useful lives are reassessed annually and, if necessary, changes are recognised prospectively.
Network share assets
Certain assets have been contributed to a network share arrangement by both EE and Hutchison 3G UK Limited, with legal title
remaining with the contributor. This is considered to be a reciprocal arrangement. Our share of the assets on acquisition of EE were
recognised at fair value within tangible assets, and depreciated in line with policy. Subsequent additions are recorded at cost.
Impairment of property, plant and equipment
We test property, plant and equipment for impairment if events or changes in circumstances (assessed at each reporting date)
indicate that the carrying amount may not be recoverable. When an impairment test is performed, we assess the recoverable amount
by reference to the higher of the net present value of the expected future cash flows (value in use) of the relevant asset and the fair
value less costs to dispose. If it is not possible to determine the recoverable amount for the individual asset then we assess
impairment by reference to the relevant cash generating unit as described in note 14.
Key judgements made in accounting for our BDUK contracts
We receive government grants in relation to the Broadband Delivery UK (BDUK) programme and other rural superfast broadband
contracts. Where we have achieved certain service levels, or delivered the network more efficiently than anticipated, we have an
obligation to either re-invest or repay grant funding. Where this is the case, we assess and defer the income with a corresponding
increase in capital expenditure.
Assessing the timing of whether and when we change the estimated take-up assumption is judgemental as it involves considering
information which is not always observable. Our consideration on whether and when to change the base case assumption is
dependent on our expectation of the long-term take-up trend.
Our assessment of how much grant income to defer includes consideration of the difference between the take-up percentage agreed
with the local authority and the likelihood of actual take-up. The value of the government grants deferred is disclosed in note 18.

140
BT Group plc Annual Report 2019
Notes to the consolidated financial statements continued
15. Property, plant and equipment continued
Land and
buildings
a
£m
Network
infrastructure
a
£m
Other
b
£m
Assets in
course of
construction
£m
Total
£m
Cost
At 31 March 2017 1,302 49,372 1,938 1,413 54,025
Additions
c
12 193 92 2,597 2,894
Transfers 36 2,793 16 (2,845) –
Disposals and adjustments
d
(82) (1,540) (119) (48) (1,789)
Exchange differences (6) (35) (13) 1 (53)
At 31 March 2018 1,262 50,783 1,914 1,118 55,077
Additions
c
12 97 119 3,034 3,262
Transfers 13 2,988 18 (3,063) (44)
Disposals and adjustments
d
(178) (1,943) (333) 102 (2,352)
Exchange differences (2) (32) 4 – (30)
At 31 March 2019 1,107 51,893 1,722 1,191 55,913
Accumulated depreciation
At 31 March 2017 817 35,214 1,554 – 37,585
Charge for the year 57 2,213 121 – 2,391
Disposals and adjustments
d
(96) (1,613) (107) – (1,816)
Exchange differences (5) (24) (10) – (39)
At 31 March 2018 773 35,790 1,558 – 38,121
Charge for the year 51 2,236 105 – 2,392
Transfers 1 (4) – – (3)
Disposals and adjustments
d
(104) (1,940) (296) – (2,340)
Exchange differences (1) (30) 4 – (27)
At 31 March 2019 720 36,052 1,371 – 38,143
Carrying amount
At 31 March 2019 387 15,841 351 1,191 17,770
Engineering stores – – – 65 65
Total at 31 March 2019 387 15,841 351 1,256 17,835
At 31 March 2018 489 14,993 356 1,118 16,956
Engineering stores – – – 44 44
Total at 31 March 2018 489 14,993 356 1,162 17,000
a
The carrying amount of the group’s property, plant and equipment includes an amount of £34m (2017/18: £53m) in respect of assets held under finance leases, comprising land and buildings of £34m
(2017/18: £42m) and network infrastructure of £nil (2017/18: £11m). The depreciation expense on those assets in 2018/19 was £2m (2017/18: £10m), comprising land and buildings of £2m
(2017/18: £3m) and network infrastructure of £nil (2017/18: £7m).
b
Other mainly comprises motor vehicles, computers and fixtures and fittings.
c
Net of grant deferral of £63m (2017/18: £74m net grant funding).
d
Fully depreciated assets in the group’s fixed asset registers were reviewed during the year, as part of the group’s annual asset verification exercise, and certain assets that were no longer in use have been
written off, reducing cost and accumulated depreciation by £1.9bn (2017/18: £1.3bn). Disposals and adjustments also reflect the reclassification of the BT Centre property to held for sale (£89m), and
£124m of adjustments resulting from changes in assumptions used in calculating lease-end obligations where the corresponding asset is capitalised.
At 31 March
2019
£m
2018
£m
The carrying amount of land and buildings, including leasehold improvements, comprised:
Freehold 158 261
Leasehold 229 228
Total land and buildings 387 489
Network infrastructure
Some of our network assets are jointly controlled by EE Limited with Hutchison 3G UK Limited. These relate to shared 3G network and
certain elements of network for 4G rural sites. The net book value of the group’s share of assets controlled by its joint operation MBNL is
£584m (2017/18: £526m) and is recorded within network infrastructure. Included within this is £125m (2017/18: £132m), being
the group’s share of assets owned by its joint operation MBNL.
Within network infrastructure are assets with a net book value of £9.0bn (2017/18: £8.3bn) which have useful economic lives of more
than 18 years.

BT Group plc Annual Report 2019
141
Strategic report
Governance
Financial statements
Additional information
16. Programme rights
Significant accounting policies that apply to programme rights
Programme rights are recognised on the balance sheet from the point at which the legally enforceable licence period begins. They
are initially recognised at cost and are amortised from the point at which they are available for use, on a straight line basis over the
programming period, or the remaining licence term, as appropriate, which is generally 12 months. Programme rights are tested for
impairment in accordance with our impairment policy as set out in note 14.
Additions reflect TV programme rights for which the legally enforceable licence period has started during the year. Rights for which
the licence period has not started are disclosed as contractual commitments in note 30. Payments made to receive commissioned or
acquired programming in advance of the legal right to broadcast the programmes are classified as prepayments (see note 17).
Programmes produced internally are charged to the income statement over the period of the related broadcast.
Total
£m
At 1 April 2017 264
Additions 771
Amortisation (763)
At 1 April 2018 272
Additions 879
Amortisation (841)
At 31 March 2019 310
17. Trade and other receivables
Significant accounting policies that apply to trade and other receivables
We initially recognise trade and other receivables at fair value, which is usually the original invoiced amount. They are subsequently
carried at amortised cost using the effective interest method. The carrying amount of these balances approximates to fair value due
to the short maturity of amounts receivable.
We provide services to consumer and business customers, mainly on credit terms. We know that certain debts due to us will not be
paid through the default of a small number of our customers. Because of this, we recognise an allowance for doubtful debts on initial
recognition of receivables, which is deducted from the gross carrying amount of the receivable. The allowance is calculated by
reference to credit losses expected to be incurred over the lifetime of the receivable. In estimating a loss allowance we consider
historical experience and informed credit assessment alongside other factors such as the current state of the economy and particular
industry issues. We consider reasonable and supportable information that is relevant and available without undue cost or effort.
Once recognised, trade receivables are continuously monitored and updated. Allowances are based on our historical loss experiences
for the relevant aged category as well as forward-looking information and general economic conditions. Allowances are calculated by
individual customer-facing units in order to reflect the specific nature of the customers relevant to that customer-facing unit.
At 31 March
2019
£m
2018
£m
2017
£m
Current
Trade receivables 1,732 1,741 1,774
Prepayments
a
698 1,103 733
Accrued income
b
34 777 955
Deferred contract costs
c
417 – –
Other receivables
d
341 393 373
3,222 4,014 3,835
At 31 March
2019
£m
2018
£m
2017
£m
Non-current
Other assets
e
173 317 360
Deferred contract costs
c
272 – –
445 317 360
a
2017/18 includes £325m in respect of the acquisition of Spectrum.
b
Accrued income recognised in prior years has been substantially reclassified to contract assets on adoption of IFRS 15. See notes 1 and 2.
c
Deferred contract costs arise following adoption of IFRS 15 on 1 April 2018. See notes 1 and 2.
d
Other receivables includes assets held for sale of £nil (2017/18: £nil, 2016/17: £22m). £89m assets held for sale as at 31 March 2019 are presented separately on the face of the balance sheet.
e
Other assets comprise prepayments and leasing debtors. Included in prior year comparatives are costs relating to the initial set-up, transition or transformation phase of long-term networked IT services
contracts (2017/18: £145m, 2016/17: £163m), which are presented within deferred contract costs following adoption of IFRS 15.

142
BT Group plc Annual Report 2019
Notes to the consolidated financial statements continued
17. Trade and other receivables continued
Trade receivables are stated after deducting allowances for doubtful debts, as follows:
2019
£m
2018
£m
2017
£m
At 1 April 375 303 195
Expense 95 129 211
Utilised (165) (61) (114)
Exchange differences (6) 4 11
At 31 March 299 375 303
Included within the 2016/17 expense above are amounts for exposures relating to the Italian business investigation.
Note 27 provides further disclosure regarding the credit quality of our gross trade receivables. Trade receivables are due as follows:
Past due and not specifically impaired
At 31 March
Not past due
£m
Trade
receivables
specifically
impaired net
of provision
£m
Between
0 and 3
months
£m
Between
3 and 6
months
£m
Between
6 and 12
months
£m
Over 12
months
£m
Total
£m
2019 1,229 34 371 42 40 16 1,732
2018 1,251 61 293 44 25 67 1,741
2017 1,184 146 292 17 41 94 1,774
Gross trade receivables which have been specifically impaired amounted to £57m (2017/18: £124m, 2016/17: £238m).
Trade receivables not past due and accrued income are analysed below by customer-facing unit.
Trade receivables not past due Accrued income
At 31 March
2019
£m
2018
£m
2017
£m
2019
£m
2018
£m
2017
£m
Consumer 457 – – 32 – –
Enterprise 274 – – 2 – –
Global Services 498 477 444 – 222 297
Openreach – 61 1 – 67 78
BT Consumer – 157 128 – 86 90
EE – 206 335 – 122 170
Business and Public Sector – 253 200 – 134 151
Wholesale and Ventures – 92 75 – 145 167
Other – 5 1 – 1 2
Total 1,229 1,251 1,184 34 777 955
Given the broad and varied nature of our customer base, the analysis of trade receivables not past due and accrued income by
customer-facing unit is considered the most appropriate disclosure of credit concentrations. Cash collateral held against trade and
other receivables amounted to £9m (2017/18: £6m, 2016/17: £4m).
Deferred contract costs
Significant accounting policies that apply to deferred contract costs
We capitalise certain costs associated with the acquisition and fulfilment of contracts with customers and amortise them over the
period that we transfer the associated services.
Connection costs are deferred as contract fulfilment costs because they allow satisfaction of the associated connection performance
obligation and are considered recoverable. Sales commissions and other third party contract acquisition costs are capitalised as costs
to acquire a contract unless the associated contract term is less than 12 months, in which case they are expensed as incurred.
Capitalised costs are amortised over the minimum contract term. A portfolio approach is used to determine contract term.
Where the initial set-up, transition and transformation phases of long-term contractual arrangements represent distinct
performance obligations, costs in delivering these services are expensed as incurred. Where these services are not distinct
performance obligations, we capitalise eligible costs as a cost of fulfilling the related service. Capitalised costs are amortised on a
straight line basis over the remaining contract term, unless the pattern of service delivery indicates a more appropriate profile. To be
eligible for capitalisation, costs must be directly attributable to specific contracts, relate to future activity, and generate future
economic benefits. Capitalised costs are regularly assessed for recoverability.

BT Group plc Annual Report 2019
143
Strategic report
Governance
Financial statements
Additional information
17. Trade and other receivables continued
The following table shows the movement on deferred costs:
Deferred
connection
costs
£m
Deferred
contract
acquisition
costs –
commissions
£m
Deferred
contract
acquisition
costs – dealer
incentives
£m
Transition and
transformation
£m
Total
£m
At 1 April 2018 7 85 416 161 669
Additions 15 76 446 32 569
Amortisation (14) (76) (426) (53) (569)
Impairment – (5) (4) (1) (10)
Other 23 6 – 1 30
At 31 March 2019 31 86 432 140 689
18. Trade and other payables
Significant accounting policies that apply to trade and other payables
We initially recognise trade and other payables at fair value, which is usually the original invoiced amount. We subsequently carry
them at amortised cost using the effective interest method.
At 31 March
2019
£m
2018
£m
2017
£m
Current
Trade payables 4,141 3,991 4,205
Other taxation and social security 564 704 704
Other payables 387 456 672
Accrued expenses 630 492 382
Deferred income
a
68 1,525 1,474
5,790 7,168 7,437
At 31 March
2019
£m
2018
£m
2017
£m
Non-current
Other payables
b
873 871 885
Deferred income
a
606 455 413
1,479 1,326 1,298
a
Deferred income recognised in prior periods has substantially been reclassified to contract liabilities on adoption of IFRS 15, see notes 1 and 2. The remaining balance includes £51m (2017/18: £132m,
2016/17: £71m) current and £586m (2017/18: £404m, 2016/17: £375m) non-current liabilities relating to the Broadband Delivery UK programme, for which grants received by the group may be
subject to re-investment or repayment depending on the level of take-up.
b
Other payables relate to operating lease liabilities and deferred gains on a 2001 sale and finance leaseback transaction.
19. Provisions
Our provisions principally relate to obligations arising from property rationalisation programmes, restructuring programmes, asset
retirement obligations, network assets, insurance claims, litigation and regulatory risks.
Significant accounting policies that apply to provisions
We recognise provisions when the group has a present legal or constructive obligation as a result of past events, it is probable that an
outflow of resources will be required to settle the obligation and the amount can be reliably estimated. Provisions are determined by
discounting the expected future cash flows at a pre-tax rate that reflects current market assessments of the time value of money and
the risks specific to the liability. Financial liabilities within provisions are initially recognised at fair value and subsequently carried at
amortised cost using the effective interest method. We measure onerous lease provisions at the lower of the cost to fulfil or to exit
the contract.
Critical accounting estimates and key judgements made in accounting for provisions
We exercise judgement in determining the timing and quantum of all provisions to be recognised. Our assessment includes
consideration of whether we have a present obligation, whether payment is probable and if so whether the amount can be estimated
reliably.
As part of this assessment, we also assess the likelihood of contingent liabilities occurring in the future which are not recognised as
liabilities on our balance sheet. By their nature, contingencies will be resolved only when one or more uncertain future events occur
or fail to occur. We assess the likelihood that a potential claim or liability will arise and also quantify the possible range of financial
outcomes where this can be reasonably determined. We’ve disclosed our assessment of contingent liabilities in note 30.

144
BT Group plc Annual Report 2019
Notes to the consolidated financial statements continued
19. Provisions continued
Restructuring programmes involve estimation of the direct cost necessary for the restructuring and exclude items that are associated
with ongoing activities. The amounts below exclude restructuring costs for which the timing and amount are certain. These are
recognised as part of trade and other payables.
Under our property rationalisation programmes we’ve identified a number of surplus leased properties. Although efforts are being
made to sublet this space, this is not always possible. Estimates have been made of the cost of vacant possession and of any shortfall
arising from any potential sub-lease income being lower than the lease costs. Any such shortfall is recognised as a provision. We have
also made estimates of the costs to restore properties upon vacation where this is required under the lease agreements.
Asset retirement obligations (AROs) involve an estimate of the cost to dismantle equipment and restore network sites upon vacation
and the timing of the event. The provision represents the group’s best estimate of the amount that may be required to settle the
obligation.
Network asset provisions represent our future operational costs and vacant site rentals arising from obligations relating to network
share agreements. Costs are expected to be incurred over a period of up to 20 years.
Our regulatory provision represents our best estimate of the cost to settle our present obligation in relation to historical regulatory
matters. The charge for the year represents the outcome of management’s re-assessment of the estimates and regulatory risks
across a range of issues, including price and service issues. The prices at which certain services are charged are regulated and may be
subject to retrospective adjustment by regulators. Estimates are used in assessing the likely value of the regulatory risk.
For all risks, the ultimate liability may vary materially from the amounts provided and will be dependent upon the eventual outcome
of any settlement.
Restructuring
£m
Property
£m
Network
ARO
£m
Network
share
£m
Regulatory
£m
Litigation
£m
Other
£m
Total
£m
At 31 March 2017 11 292 83 50 479 69 177 1,161
Additions 4 37 2 – 51 6 33 133
Unwind of discount – 11 2 2–––15
Utilised or released (2) (46) (16) (19) (210) (11) (32) (336)
Transfers ––––––8585
Exchange differences (1) –––––(2)(3)
At 31 March 2018 12 294 71 33 320 64 261 1,055
Additions – 84 102 2 58 3 66 315
Unwind of discount – 11 2 1–––14
Utilised or released – (71) (13) (9) (196) (9) (109) (407)
Transfers (12) 21–––27(7)29
Exchange differences –––––(1)1–
At 31 March 2019 – 339 162 27 182 84 212 1,006
At 31 March
2019
£m
2018
£m
2017
£m
Analysed as:
Current 424 603 625
Non-current 582 452 536
1,006 1,055 1,161
In 2016/17 we recognised a £300m charge in relation to estimated deemed consent compensation payments. In 2016/17 a related
fine of £42m was imposed and was recognised as a payable rather than as a provision. The provision movement in the year reflects the
completion of the majority of deemed consent compensation payments, and new matters arising across a range of issues, including
price and service issues, and the re-assessment of other regulatory risks and in light of historic regulatory decisions by Ofcom. The
movement has been recorded as a specific item.
Included within ‘Other’ provisions are contract loss provisions of £25m (2017/18: £38m) relating to the anticipated total losses in
respect of certain contracts. It is expected that the majority of these provisions will be utilised in the next few years. Although there is a
short period remaining to the finalisation of these contracts, there remains uncertainty as to whether potential future changes to key
assumptions made when estimating their future losses could have a significant impact. There is no single change in key variables that

BT Group plc Annual Report 2019
145
Strategic report
Governance
Financial statements
Additional information
19. Provisions continued
could materially affect future expected losses on these contracts, but it is reasonably possible there will be a combination of changes in
key variables that could have a material impact. Also included in ‘Other’ are amounts provided for constructive obligations arising from
insurance claims which will be utilised as the obligations are settled.
During the year we have updated property provisions to reflect our reassessment of lease-end obligations to reflect the group’s
property strategy announced in May 2018, and to update the rate used to discount these provisions. Where additions to the provision
relate to capitalised assets there has been a corresponding increase in the asset (see note 15). Other amounts have been charged to the
income statement as specific items.
During the year we have updated provisions relating to asset retirement obligations to reflect our latest assessment of the cost to
dismantle equipment and restore the sites, and to update the rate used to discount the provisions. The increase in the provision has
been reflected in an increase in the corresponding capitalised asset (see note 15).
20. Retirement benefit plans
Background to BT’s pension plans
The group has both defined benefit and defined contribution retirement benefit plans. The group’s main plans are in the UK and the
largest by membership is the BT Pension Scheme (BTPS) which is a defined benefit plan that was closed to new entrants on 31 March
2001. After that date new entrants to BT in the UK have been able to join a defined contribution plan, currently the BT Retirement
Saving Scheme (BTRSS), a contract-based arrangement operated by Standard Life.
Sections B and C of the BTPS were closed to future benefit accrual on 30 June 2018 (which represented over 99% of the BTPS active
membership at the time) and affected employees have been able to join the BTRSS for future pension accrual. Non-management
employees will be eligible to join a new hybrid pension arrangement, the BT Hybrid Scheme, between 1 April 2019 and 30 September
2019. This new arrangement combines elements of both defined benefit and defined contribution pension schemes.
EE Limited operates the EE Pension Scheme (EEPS), which has a defined benefit section that was closed to future benefit accrual in
2014 and a defined contribution section which is open to new joiners.
We also have retirement arrangements around the world in line with local markets and culture.
What are they? How do they impact BT’s financial statements?
Defined contribution
plans
Benefits in a defined contribution plan are linked
to:
• contributions paid
• the performance of each individual’s chosen
investments
• the form in which individuals choose to take their
benefits.
Contributions are paid into an independently
administered fund.
The income statement charge in respect of
defined contribution plans represents the
contribution payable by the group based upon a
fixed percentage of employees’ pay.
The group has no exposure to investment and
other experience risks.
Defined benefit plans
Benefits in a defined benefit plan are:
• determined by the plan rules, dependent on
factors such as age, years of service and
pensionable pay
• not dependent upon actual contributions made
by the company or members.
The income statement service cost in respect of
defined benefit plans represents the increase in
the defined benefit liability arising from pension
benefits earned by active members in the current
period.
The group is exposed to investment and other
experience risks and may need to make additional
contributions where it is estimated that the
benefits will not be met from regular
contributions, expected investment income and
assets held.
Significant accounting policies that apply to retirement benefits
Defined benefit plans
Our net obligation in respect of defined benefit pension plans is the present value of the defined benefit obligation less the fair value
of the plan assets.
The income statement expense is allocated between an operating charge and net finance income or expense.
• The operating charge reflects the increase in the defined benefit obligation resulting from the pension benefit earned by active
employees in the current period, the costs of administering the plans and any past service costs/credits such as those arising from
curtailments or settlements.

146
BT Group plc Annual Report 2019
Notes to the consolidated financial statements continued
20. Retirement benefit plans continued
• The net finance income or expense reflects the interest on the net retirement benefit obligations recognised in the group balance
sheet, based on the discount rate at the start of the year.
Remeasurements of the net pension obligation are recognised in full in the group statement of comprehensive income in the year in
which they arise. These comprise the impact on the defined benefit obligation of changes in demographic and financial assumptions
compared with the start of the year, actual experience being different to those assumptions and the return on plan assets being
above or below the amount included in the net pension interest expense.
Defined contribution plans
The income statement expense for the defined contribution pension plans we operate represents the contributions
payable for the year.
Amounts in the financial statements
Group income statement
The expense or income arising from all group retirement benefit arrangements recognised in the group income statement
is shown below.
Year ended 31 March
2019
£m
2018
£m
2017
£m
Recognised in the income statement before specific items
Service cost (including administration expenses & PPF levy):
defined benefit plans 135 376 281
defined contribution plans 476 265 240
Past service credit
a
– (17) –
Subtotal 611 624 521
Recognised in the income statement as specific items (note 10)
Costs to close BT Pension Scheme and provide transition payments
b
for affected employees 23 – –
Cost to equalise benefits between men and women due to guaranteed minimum pension (GMP)
c
26 – –
Net interest expense on pensions deficit included in specific items 139 218 209
Subtotal 188 218 209
Total recognised in the income statement 799 842 730
a
Relates to the removal of future indexation obligations following changes to the benefits provided under certain pension plans operating outside the UK in 2017/18.
b
All employees impacted by the closure of the BTPS receive transition payments into their BTRSS pot for a period linked to the employee’s age. There was no past service cost or credit on closure due to
the assumed past service benefit link as an active member being the same as that assumed for a deferred member.
c
In October, a High Court judgment involving the Lloyds Banking Group’s defined benefit pension schemes was handed down, resulting in the group needing to recognise additional liability to equalise
benefits between men and women due to GMPs, in common with most UK defined benefit schemes.
Group balance sheet
The net pension obligation in respect of defined benefit plans reported in the group balance sheet is set out below. The prior year
retirement benefit obligation has been restated as a result of a prior period accounting error, refer to note 2 for more details.
2019 2018
At 31 March
Assets
£m
Present value
of liabilities
£m
Deficit
£m
Assets
£m
Present value
of liabilities
(Restated)
£m
Deficit
(Restated)
£m
BTPS 52,186 (58,855) (6,669) 49,894 (56,259) (6,365)
EEPS 816 (997) (181) 763 (920) (157)
Other plans
a
362 (694) (332) 299 (624) (325)
Retirement benefit obligation 53,364 (60,546) (7,182) 50,956 (57,803) (6,847)
Adjustments due to effect of asset ceiling (IFRIC 14) – –
Deferred tax asset 1,208 1,164
Net pension obligation (5,974) (5,683)
a
Included in the present value of obligations of other plans is £101m (2017/18: £97m) related to unfunded pension arrangements.
Included within trade and other payables in the group balance sheet is £42m (2017/18: £17m) in respect of contributions payable to
defined contribution plans.
BT is not required to limit any pensions surplus or recognise additional pensions liabilities in individual plans as economic benefits are
available in the form of either future refunds or reductions to future contributions. This is on the basis that IFRIC 14 applies enabling a
refund of surplus following the gradual settlement of the liabilities over time until there are no members remaining in the scheme.

BT Group plc Annual Report 2019
147
Strategic report
Governance
Financial statements
Additional information
20. Retirement benefit plans continued
Movements in defined benefit plan assets and liabilities
The table below shows the movements on the pension assets and liabilities and shows where they are reflected in the financial
statements. The prior year retirement benefit obligation has been restated as a result of a prior period accounting error, refer to note 2
for more details.
Assets
£m
Liabilities
£m
Deficit
£m
At 31 March 2017 51,112 (60,200) (9,088)
Service cost (including administration expenses and PPF levy) (67) (309) (376)
Past service credit –1717
Interest on pension deficit 1,201 (1,419) (218)
Included in the group income statement (577)
Return on plan assets above the amount included in the group income statement 10 – 10
Actuarial gain arising from changes in financial assumptions
a
– 2,251 2,251
Actuarial loss arising from changes in demographic assumptions
a
(Restated) – (697) (697)
Actuarial gain arising from experience adjustments
b
– 120 120
Included in the group statement of comprehensive income 1,684
Regular contributions by employer 264 – 264
Deficit contributions by employer 872 – 872
Included in the group cash flow statement 1,136
Contributions by employees 2 (2) –
Benefits paid (2,449) 2,449 –
Foreign exchange 11 (13) (2)
Other movements (2)
At 31 March 2018 (Restated) 50,956 (57,803) (6,847)
Service cost (including administration expenses and PPF levy) (49) (86) (135)
Costs to close BT Pension Scheme (6) – (6)
Cost to equalise benefits between men and women due to guaranteed minimum pension (GMP) – (26) (26)
Interest on pension deficit 1,356 (1,495) (139)
Included in the group income statement (306)
Return on plan assets above the amount included in the group income statement 1,607 – 1,607
Actuarial loss arising from changes in financial assumptions
a
– (3,920) (3,920)
Actuarial gain arising from changes in demographic assumptions
a
– 247 247
Actuarial loss arising from experience adjustments
b
– (36) (36)
Included in the group statement of comprehensive income (2,102)
Regular contributions by employer 43 – 43
Deficit contributions by employer 2,024 – 2,024
Included in the group cash flow statement 2,067
Contributions by employees 1 (1) –
Benefits paid (2,564) 2,564 –
Foreign exchange (4) 10 6
Other movements 6
At 31 March 2019 53,364 (60,546) (7,182)
a
The actuarial gain or loss arises from changes in the assumptions used to value the defined benefit liabilities at the end of the year compared with the assumptions used at the start of the year. This
includes both financial assumptions, which are based on market conditions at the year end, and demographic assumptions such as life expectancy.
b
The actuarial loss or gain arising from experience adjustments on defined benefit liabilities represents the impact on the liabilities of differences between actual experience during the year compared with
the assumptions made at the start of the year. Such differences might arise, for example, from members choosing different benefit options at retirement, actual salary increases being different from
those assumed or actual benefit increases being different to the pension increase assumption.
How do we value our retirement benefit plans?
Valuation methodology
The IAS 19 liabilities are measured as the present value of the estimated future benefit cash flows to be paid by each scheme, calculated
using the projected unit credit method. These calculations are performed for the group by professionally qualified actuaries.
The expected future benefit payments are based on a number of assumptions including future inflation, retirement ages, benefit options
chosen and life expectancy and are therefore inherently uncertain. Actual benefit payments in a given year may be higher or lower, for
example if members retire sooner or later than assumed, or take a greater or lesser cash lump sum at retirement than assumed.
Critical accounting judgements and key estimates made when valuing our retirement benefit plans
The accounting cost of these benefits and the present value of our pension liabilities involve judgements about uncertain events
including the life expectancy of the members, price inflation and the discount rate used to calculate the net present value of the
future pension payments. We use estimates for all of these uncertain events in determining the pension costs and liabilities in our
financial statements. Our assumptions reflect historical experience, external advice and our judgement regarding future
expectations. Financial assumptions are based on market expectations at the balance sheet date.

148
BT Group plc Annual Report 2019
Notes to the consolidated financial statements continued
20. Retirement benefit plans continued
The fair value of our pension asset is made up of quoted and unquoted investments. The latter require more judgement as their
values are not directly observable. The assumptions used in valuing unquoted investments are affected by current market conditions
and trends which could result in changes in fair value after the measurement date.
How do we value the assets?
Under IAS 19, plan assets must be valued at the bid market value at the balance sheet date. For the main asset categories:
• Equities listed on recognised stock exchanges are valued at closing bid prices.
• Properties are valued on the basis of open market value.
• Bonds are measured using a combination of broker quotes and pricing models making assumptions for credit risk, market risk and
market yield curves.
• Holdings in investment funds are valued at fair value which is typically the Net Asset Value provided by the investment manager.
• Certain unlisted investments are valued using a model based valuation such as a discounted cash flow.
• The value of the longevity insurance contract held by the BTPS is measured by discounting the projected cash flows payable under
the contract (projected by an actuary, consistent with the terms of the contract).
Overview and governance of the BTPS
What is the profile of the BTPS?
At 31 March 2019 there were 288,000 members of the BTPS. Members belong to one of three sections depending upon the date they
first joined the BTPS. The membership is analysed below.
Analysis of BTPS
Active
members
Deferred
members Pensioners Total
Sections A and B liabilities (£bn)
a
– 9.0 31.5 40.5
Section C liabilities (£bn) – 14.1 4.3 18.4
Total IAS 19 liabilities (£bn) – 23.1 35.8 58.9
Total number of members –
b
83,000 205,000 288,000
a
Sections A and B have been aggregated in this table as Section A members have typically elected to take Section B benefits at retirement.
b
At 31 March 2019 there are around 50 active members in the BTPS.
The estimated duration of the BTPS liabilities, which is an indicator of the weighted average term of the liabilities, is around 16 years
although the benefits payable by the BTPS are expected to be paid over more than 70 years. Whilst benefit payments are expected to
increase over the earlier years, the value of the liabilities is expected to reduce.
The chart below illustrates the estimated benefits payable from the BTPS forecast using the IAS 19 assumptions.
Forecast benefits payable by the BTPS at 31 March 2019 (unaudited)
a
Based on accrued benefits to 30 June 2018.

BT Group plc Annual Report 2019
149
Strategic report
Governance
Financial statements
Additional information
20. Retirement benefit plans continued
What are the benefits under the BTPS?
Benefits earned for pensionable service prior to 1 April 2009 are based upon a member’s final salary and a normal pensionable
age of 60.
Between 1 April 2009 and 30 June 2018, Section B and C active members accrued benefits based upon a career average re-valued
earnings (CARE) basis and a normal pensionable age of 65. On a CARE basis benefits are built up based upon earnings in each year and
the benefit accrued for each year is increased by the lower of inflation or the individual’s actual pay increase in each year to retirement.
Under the Scheme rules the determination of the rate of inflation for statutory minimum rates of revaluation and indexation for the
majority of benefits is based upon either the Retail Price Index (RPI) or the Consumer Price Index (CPI) which apply to each category of
member as shown below.
Active members Deferred members Pensioners
Section B
a
Benefits accrue on a CARE basis increasing
at the lower of RPI or the individual’s actual
pensionable pay increase
Preserved benefits are revalued before
retirement based upon CPI
Increases in benefits in payment are
currently based upon CPI
Section C Increases in benefits in payment are
currently based upon RPI up to a
maximum of 5%
a
Section A members have typically elected to take Section B benefits at retirement.
In December 2018, the Court of Appeal upheld the High Court’s ruling that it is currently not possible to change the index used to
calculate pension increases paid in the future to members of Section C of the BTPS from RPI to another index. BT is seeking permission
to appeal the decision from the Supreme Court.
How is the BTPS governed and managed?
BT Pension Scheme Trustees Limited (the Trustee) has been appointed by BT as an independent trustee to administer and manage the
BTPS on behalf of the members in accordance with the terms of the BTPS Trust Deed and Rules and relevant legislation (principally the
Pension Schemes Act 1993, the Pensions Act 1995 and the Pensions Act 2004).
Under the terms of the Trust Deed there are nine Trustee directors, all of whom are appointed by BT, as illustrated below. Trustee
directors are usually appointed for a three-year term but are then eligible for re-appointment.
Appointed by BT after consultation with,
and with the agreement of, the relevant
trade unions.
Chairman of the Trustees
Appointed by BT based on nominations
by trade unions.
Member nominated Trustees
Appointed by BT. Two normally hold senior
positions within the group and two normally
hold (or have held) senior positions in
commerce or industry.
Employer nominated Trustees
BTPS assets
Asset allocation
The allocation of assets between different classes of investment is reviewed regularly and is a key factor in the Trustee’s investment
policy. The allocations reflect the Trustee’s views on the appropriate balance to be struck between seeking returns and incurring risk,
and on the extent to which the assets should be allocated to match liabilities. Current market conditions and trends are regularly
assessed which may lead to adjustments in the asset allocation.

150
BT Group plc Annual Report 2019
Notes to the consolidated financial statements continued
20. Retirement benefit plans continued
The fair value of the assets of the BTPS analysed by asset category are shown below. These are subdivided by assets that have a quoted
market price in an active market and those that do not (such as investment funds).
2019
a
2018
a
Total
assets
£bn
of which
quoted
b
£bn
Total
%
Total
assets
£bn
of which
quoted
b
£bn
Total
%
Growth
Equities UK 0.5
0.4
1 0.5
0.5
1
Overseas developed 7.7
7.3
15 7.8
7.3
16
Emerging markets 1.1
1.1
2 0.5
0.4
1
Private Equity 1.5
–
3 1.9
–
4
Property UK 3.5
–
7 3.9
–
8
Overseas 1.1
–
2 1.2
–
2
Other growth assets Absolute Return
c
1.2
–
2 1.5
–
3
Non Core Credit
d
3.8
1.1
7 3.4
1.0
7
Mature Infrastructure 1.4
–
3 1.4
–
3
Liability matching
Government bonds UK Index Linked 13.2
13.2
25 12.5
12.5
25
Investment grade credit Global 14.3
10.1
27 10.0
8.0
20
Cash, derivatives and other
Cash balances 2.7
–
5 3.8
–
7
Longevity insurance contract
e
(0.7)
–
(1) (0.4)
–
(1)
Other
f
0.9
–
2 1.9
–
4
Total 52.2
33.2
100 49.9
29.7
100
a
At 31 March 2019, the Scheme did not hold any equity issued by the group (2017/18: £3m). The Scheme also held £2,154m (2017/18: £10m) of bonds issued by the group, reflecting the BTPS fully
subscribing to £2bn of bonds issued by BT in June 2018 following agreement of the 2017 funding valuation.
b
Assets with a quoted price in an active market.
c
This allocation seeks to generate returns irrespective of the direction of markets. Managers within this allocation will typically manage their portfolios without close regard to a specific market
benchmark.
d
This allocation includes a range of credit investments, including emerging market, sub-investment grade and unrated credit. The allocation seeks to exploit investment opportunities within credit
markets using the expertise of a range of specialist investment managers.
e
The Trustee has hedged some of the Scheme’s longevity risk through a longevity insurance contract which was entered into in 2014. The value reflects experience to date on the contract from higher
than expected deaths. This amount partly offsets a reduction which would be recognised in the Scheme’s liabilities over time.
f
Includes collateral posted in relation to derivatives held by the Scheme.
IAS 19 assumptions
The table below summarises the approach used to set the key IAS 19 assumptions for the BTPS.
Approach to set the assumption
Discount rate IAS 19 requires that the discount rate is determined by reference to market yields at the
reporting date on high quality corporate bonds. The currency and term of these should be
consistent with the currency and estimated term of the pension obligations.
The assumption is calculated by applying the projected BTPS benefit cash flows to a
corporate bond yield curve constructed by our external actuary based on the yield on
AA-rated corporate bonds.
In setting the yield curve, judgement is required on the selection of appropriate bonds to
be included in the universe and the approach used to then derive the yield curve.
RPI inflation The RPI inflation assumption is set using an inflation curve derived from market yields on
government bonds, weighted by projected BTPS benefit cash flows, and making an
adjustment for an inflation risk premium (to reflect the extra premium paid by investors
for inflation protection), which is currently assumed to be 20bps.
CPI inflation CPI is assessed at a margin below RPI taking into account market forecasts and
independent estimates of the expected difference.
Pension increases Benefits are assumed to increase in line with the RPI or CPI inflation assumptions, based
on the relevant index for increasing benefits, as prescribed by the rules of the BTPS and
summarised above.

BT Group plc Annual Report 2019
151
Strategic report
Governance
Financial statements
Additional information
20. Retirement benefit plans continued
Approach to set the assumption
Longevity The longevity assumption takes into account:
• the actual mortality experience of the BTPS pensioners, based on a formal review
conducted at the 2014 triennial funding valuation
• future improvements in longevity based on a model published by UK actuarial
profession’s Continuous Mortality Investigation (using the CMI 2017 Mortality
Projections model with a 1.25% per year long-term improvement parameter).
The key financial assumptions used to measure the liabilities of the BTPS are shown below.
Nominal rates (per year) Real rates (per year)
a
At 31 March
2019
%
2018
%
2017
%
2019
%
2018
%
2017
%
Rate used to discount liabilities 2.35 2.65 2.40 (0.87) (0.44) (0.78)
Inflation – increase in RPI 3.25 3.10 3.20 – – –
Inflation – increase in CPI 2.25
b
2.00
c
2.00
d
(1.0)
b
(1.1)
c
(1.2)
d
a
The real rate is calculated relative to RPI inflation.
b
Assumed to be 0.1% lower until 31 March 2023.
c
Assumed to be 0.1% higher until 31 March 2023.
d
Assumed to be 0.5% higher until 31 March 2019.
The BTPS represents over 97% of the group’s retirement benefit obligation. While the financial assumptions may vary for each plan,
the nominal financial assumptions weighted by liabilities across all plans are equal to the figures shown in the table above (to the
nearest 0.05%).
Based on the IAS 19 longevity assumptions, the forecast life expectancies for BTPS members aged 60 are as follows:
At 31 March
2019
Number of
years
2018
Number of
years
Male in lower pay bracket 25.7 25.8
Male in medium pay bracket 27.0 27.1
Male in higher pay bracket 28.5 28.5
Female in lower pay bracket 28.5 28.5
Female in higher pay bracket 28.7 28.7
Average improvement for a member retiring at age 60 in 10 years’ time 0.7 0.7
Risks underlying the assumptions
Background
The BTPS faces similar risks to other UK DB schemes: things like future low investment returns, high inflation, longer life expectancy and
regulatory changes may all mean the BTPS becomes more of a financial burden. Further details are set out on page 47.
Changes in external factors, such as interest rates, can have an impact on the IAS 19 assumptions, impacting the measurement of BTPS
liabilities. These factors can also impact the Scheme assets. The BTPS hedges some of these risks, including longevity and currency using
financial instruments and insurance contracts.
Some of the key financial risks, and mitigations, for the BTPS are set out in the table below.
Changes in bond yields A fall in yields on AA-rated corporate bonds, used to set the IAS 19 discount rate, will lead to an increase in the
IAS 19 liabilities.
The BTPS’s assets include corporate bonds, government bonds and interest rate derivatives which are expected to
partly offset the impact of movements in the discount rate. However, yields on these assets may diverge compared
with the discount rate in some scenarios.
Changes in inflation
expectations
A significant proportion of the benefits paid to members are currently increased in line with RPI or CPI inflation. An
increase in long-term inflation expectations will lead to an increase in the IAS 19 liabilities.
The BTPS’s assets include index-linked government bonds and inflation derivatives which are expected to largely
offset the impact of movements in inflation expectations.
Changes in life expectancy An increase in the life expectancy of members will result in benefits being paid out for longer, leading to an increase
in the BTPS liabilities.
The BTPS holds a longevity insurance contract which covers around 25% of the BTPS’s total exposure to
improvements in longevity, providing long-term protection and income to the BTPS in the event that members live
longer than currently expected.
Other risks include: volatile asset returns (ie where asset returns differ from the discount rate); changes in legislation or regulation which
impact the value of the liabilities or assets; and member take-up of options before and at retirement to reshape their benefits.
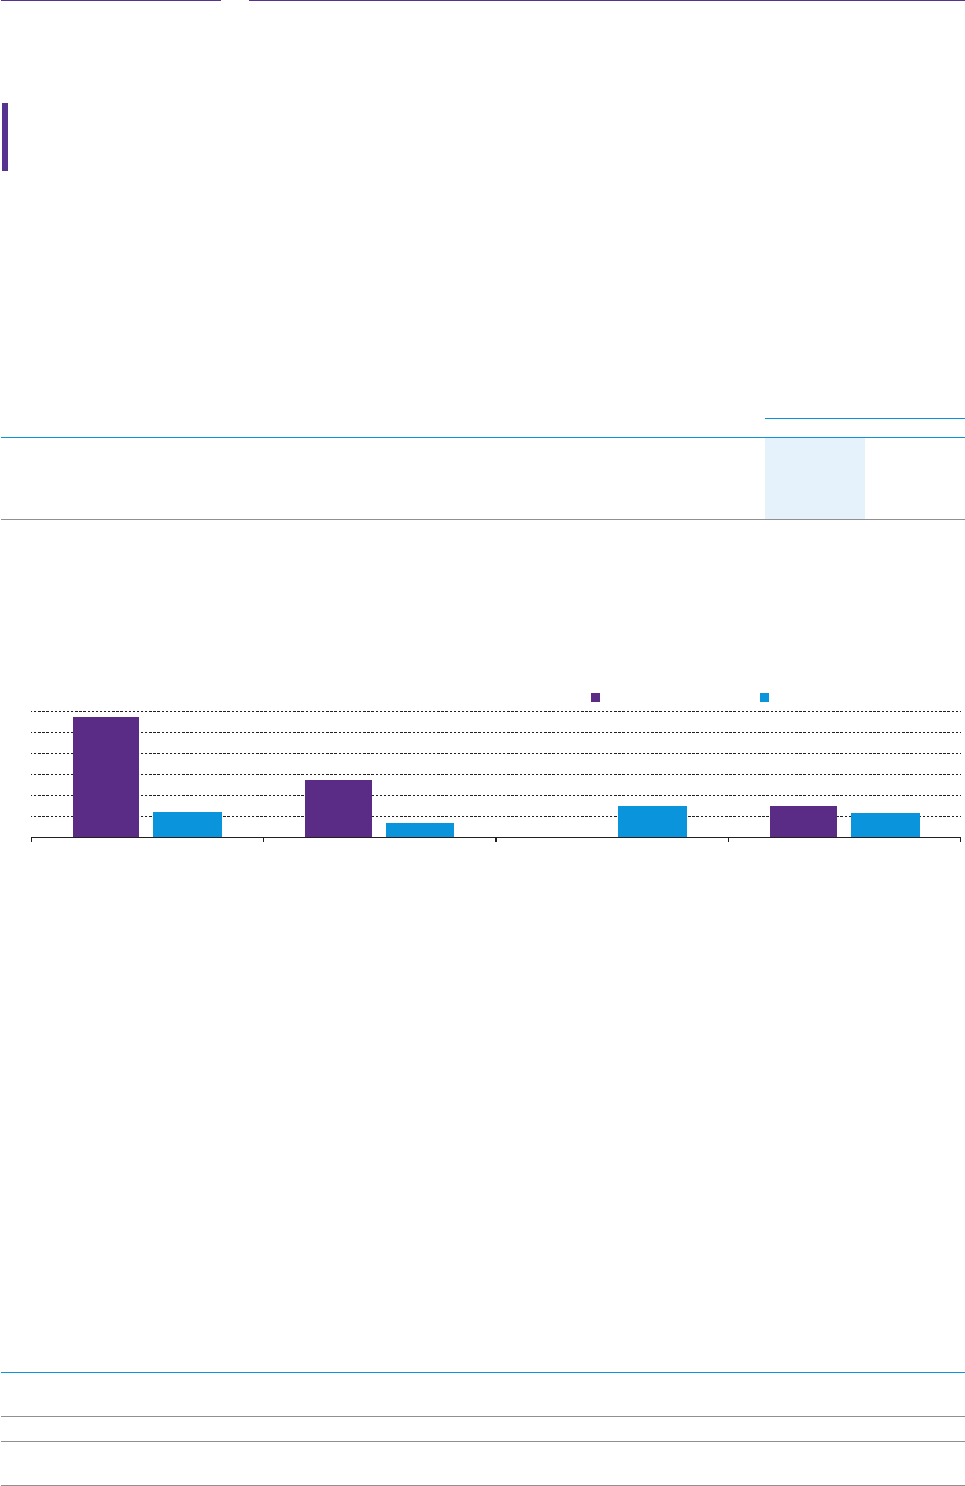
152
BT Group plc Annual Report 2019
Notes to the consolidated financial statements continued
20. Retirement benefit plans continued
Quantification
BT’s independent actuary has assessed the potential negative impact of the key risks that might occur no more than once in every
20 years illustrated as the following four scenarios:
1-in-20 events
Scenario 2019 2018
1. Fall in discount rate
a
1.1% 1.1%
2. Increase to inflation rate
b
0.7% 0.7%
3. Fall in equity markets
c
30.0% –
4. Increase to life expectancy 1.25 years 1.35 years
a
Scenario assumes a fall in the yields on both government and corporate bonds.
b
Assuming RPI, CPI, pension increases and salary increases all increase by the same amount.
c
Scenario ignores any potential benefit from derivatives held by the scheme.
The impact shown under each scenario looks at each event in isolation – in practice a combination of events could arise.
Sensitivity analysis of the principal assumptions to 1-in-20 events used to measure BTPS IAS 19 liabilities
0
1.1 percentage point fall in
discount rate
0.7 percentage point increase
to inflation rate
30% fall in equities 1.25 year increase to life
expectancy
2
4
6
8
10
12
1.2
5.4
2.3
£bn
11.4
2.2
2.9
Increase in liabilities Increase in deficit
2.8
The sensitivity of the deficit allows for both the change in the liabilities and the assumed change in the assets. For example, the increase
in the deficit under the life expectancy scenario incorporates the expected movement in the value of the insurance contract held to
hedge longevity risk.
The sensitivities have been prepared using the same approach as 2017/18 which involves calculating the liabilities and deficit using the
alternative assumptions stated.
BTPS funding
Triennial funding valuation
The triennial valuation is carried out for the Trustee by a professionally qualified independent actuary. The purpose of the valuation is to
design a funding plan to ensure that the BTPS has sufficient funds available to meet future benefit payments. The latest funding
valuation was performed as at 30 June 2017. The next funding valuation will have an effective date of no later than 30 June 2020.
The valuation methodology for funding purposes, which is based on prudent assumptions, is broadly as follows:
• Assets are valued at market value at the valuation date.
• Liabilities are measured on an actuarial funding basis using the projected unit credit method and discounted to their present value.
The results of the two most recent triennial valuations are shown below.
June
2017
valuation
£bn
June
2014
valuation
£bn
BTPS liabilities (60.4) (47.2)
Market value of BTPS assets 49.1 40.2
Funding deficit (11.3) (7.0)
Percentage of accrued benefits covered by BTPS assets at valuation date 81.3% 85.2%
Percentage of accrued benefits on a solvency basis covered by the BTPS assets at the valuation date 62.2% 63.0%

BT Group plc Annual Report 2019
153
Strategic report
Governance
Financial statements
Additional information
20. Retirement benefit plans continued
Key assumptions – funding valuation
These valuations were determined using the following prudent long-term assumptions.
Nominal rates (per year) Real rates (per year)
a
June
2017
valuation
%
June
2014
valuation
%
June
2017
valuation
%
June
2014
valuation
%
Average single equivalent discount rate 2.6 4.5 (0.8) 1.0
Average long-term increase in RPI 3.4 3.5 – –
Average long-term increase in CPI 2.4 2.5 (1.0) (1.0)
a
The real rate is calculated relative to RPI inflation and is shown as a comparator.
The discount rate at 30 June 2017 was derived from prudent return expectations above a risk-free yield curve based on gilt and swap
rates. The discount rate reflects views of future returns at the valuation date, allowing for the Scheme to hold 45% of its investments in
growth assets initially, before de-risking to a low risk investment approach by 2034. This gives a prudent discount rate of 1.4% per
year above the yield curve initially, trending down to 0.7% per year above the curve in the long-term. The assumption is equivalent to
using a flat discount rate of 1.0% per year above the yield curve at the valuation date.
The average life expectancy assumptions at the valuation dates, for members 60 years of age, are as follows.
Number of years from valuation date
June
2017
assumptions
June
2014
assumptions
Male in lower pay bracket 25.9 26.1
Male in medium pay bracket 27.2 27.5
Male in high pay bracket 28.6 29.0
Female in lower pay bracket 28.6 28.9
Female in high pay bracket 28.9 29.2
Average improvement for a member retiring at age 60 in 10 years’ time 0.9 1.3
Payments made to the BTPS
Year ended 31 March
2019
£m
2018
£m
Ordinary contributions 33 248
Deficit contributions 2,000 850
Total contributions in the year 2,033 1,098
Future funding obligations and recovery plan
Under the terms of the Trust Deed, the group is required to have a funding plan, determined at the conclusion of the triennial funding
valuation, which is a legal agreement between BT and the Trustee and should address the deficit over a maximum period of 20 years.
In May 2018, the 2017 triennial funding valuation was finalised, agreed with the Trustee and certified by the Scheme Actuary. The
funding deficit at 30 June 2017 was £11.3bn. The deficit was agreed to be met over a 13 year period, with the remaining payments
shown in the table below.
BT is scheduled to make future deficit payments to the BTPS in line with the table below.
Year to 31 March 2020 2021 2022 2023 2024 2025 2026 2027 2028 2029 2030
Deficit contribution (£m) 1,250
a
900
b
900
c
907 907 907 907 907 907 907 907
a
payable by 30 June 2019.
b
£400m payable by 30 June 2020.
c
£200m payable by 30 June 2021.
Based on the 2017 funding valuation agreement, the group expects to make contributions of approximately £1,310m to the BTPS in
2019/20, comprising of contributions of approximately £60m for expenses and future accrual and deficit contributions of £1,250m.
Other protections
The 2017 funding agreement with the Trustee included additional features for BT to provide support to the BTPS. These include:
Feature Detail
Shareholder
distributions
BT will provide additional payments to the BTPS by the amount that shareholder distributions exceed a
threshold. The threshold allows for 10% per year dividend per share growth plus £200m per year of share
buybacks on a cumulative basis.
This will apply until 30 June 2021, or until the finalisation of the next valuation if earlier.
BT will also consult with the Trustee if it considers share buybacks in excess of £200m per year or making a
special dividend. This obligation is on-going until otherwise terminated.

154
BT Group plc Annual Report 2019
Notes to the consolidated financial statements continued
20. Retirement benefit plans continued
Feature Detail
Material
corporate events
In the event that BT generates net cash proceeds greater than £1.0bn from disposals (net of acquisitions) in
any 12-month period ending 30 June, BT will make additional contributions to the BTPS equal to one third of
those net cash proceeds. This obligation applies until the next valuation is signed.
BT will consult with the Trustee if:
• it considers making acquisitions with a total cost of more than £1.0bn in any 12-month period; or
• it considers making disposals of more than £1.0bn; or
• it considers making a Class 1 transaction (acquisition or disposal); or
• it is subject to a takeover offer.
This obligation is on-going until otherwise terminated.
BT will advise the Trustee should there be other material corporate events which would materially impact BT’s
covenant to the BTPS. This obligation is on-going until otherwise terminated.
Negative pledge A negative pledge that future creditors will not be granted superior security to the BTPS in excess of a £1.5bn
threshold, to cover both British Telecommunications plc and BT Group plc.
This provision applies until the deficit reduces to below £2.0bn at any subsequent funding valuation.
In the highly unlikely event that the group were to become insolvent there are additional protections of BTPS members’ benefits:
Feature Detail
Crown Guarantee The Crown Guarantee was granted by the Government when the group was privatised in 1984 and would only
come into effect upon the insolvency of BT.
The Trustee brought court proceedings to clarify the scope and extent of the Crown Guarantee. The Court of
Appeal judgment on 16 July 2014 established that:
• the Crown Guarantee covers BT’s funding obligation in relation to the benefits of members of the BTPS who
joined post-privatisation as well as those who joined pre-privatisation (subject to certain exceptions)
• the funding obligation to which the Crown Guarantee relates is measured with reference to BT’s obligation
to pay deficit contributions under the rules of the BTPS.
The Crown Guarantee is not taken into account for the purposes of the actuarial valuation of the BTPS and is
an entirely separate matter, only being relevant in the highly unlikely event that BT became insolvent.
Pension
Protection Fund
(PPF)
The Pension Protection Fund (PPF) may take over the BTPS and pay benefits not covered by the Crown
Guarantee to members.
There are limits on the amounts paid by the PPF and the PPF would not provide exactly the same benefits as
those provided under the BTPS Rules.
Other benefit plans
In addition to the BTPS, the group maintains benefit plans around the world with a focus on these being appropriate for the local market
and culture.
EE Pension Scheme (EEPS)
The EEPS is the second largest defined benefit plan sponsored by the group. It has a defined benefit section that is closed to future
accrual, with liabilities of around £1.0bn, and a defined contribution section with around 11,000 members.
At 31 March 2019, the defined benefit section’s assets are invested across a number of asset classes including global equities (23%),
property & illiquid alternatives (22%), an absolute return portfolio (25%) and a liability driven investment portfolio (30%).
The triennial valuation of the defined benefit section was performed as at 31 December 2015, and agreed in March 2017. This showed
a funding deficit of £141m. The group is scheduled to contribute £1.875m each month between 1 April 2019 and November 2020.
The next funding valuation is taking place as at 31 December 2018 and is underway.
BTRSS
The BTRSS is the largest defined contribution scheme maintained by the group with around 69,000 active members. In the year to
31 March 2019, the group contributed £388m to the BTRSS.

BT Group plc Annual Report 2019
155
Strategic report
Governance
Financial statements
Additional information
21. Own shares
Significant accounting policies that apply to own shares
Own shares are recorded at cost and deducted from equity. When shares vest unconditionally or are cancelled they are transferred
from the own shares reserve to retained earnings at their weighted average cost.
Treasury shares
a
Employee share ownership
trust
a
Total
millions £m millions £m millions £m
At 31 March 2017 8 (35) 14 (61) 22 (96)
Own shares purchased
b
43 (125) 32 (96) 75 (221)
Share options exercised
b
(1) 2 (29) 100 (30) 102
Transfer of shares to satisfy US share scheme (4) 13 – – (4) 13
Executive share awards vested – – (5) 16 (5) 16
At 1 April 2018 46 (145) 12 (41) 58 (186)
Own shares purchased
b
– – 5 (9) 5 (9)
Share options exercised
b
(1) 2 – – (1) 2
Executive share awards vested – – (8) 26 (8) 26
At 31 March 2019 45 (143) 9 (24) 54 (167)
a
At 31 March 2019, 45,308,559 shares (2017/18: 46,224,966) with an aggregate nominal value of £2m (2017/18: £2m) were held at cost as treasury shares and 9,021,714 shares (2017/18:
12,855,378) with an aggregate nominal value of £nil (2017/18: £1m) were held in the Trust.
b
See group cash flow statement on page 114. In 2018/19 the cash paid for the repurchase of ordinary share capital was £9m (2017/18: £221m). The cash received for proceeds on the issue of treasury
shares was £5m (2017/18: £53m).
The treasury shares reserve represents BT Group plc shares purchased directly by the group. The BT Group Employee Share Ownership
Trust (the Trust) also purchases BT Group plc shares.
The treasury shares and the shares in the Trust are being used to satisfy our obligations under employee share plans. Further details on
Employee Saveshare Plans and Executive share plans are provided in note 22.
22. Share-based payments
Significant accounting policies that apply to share-based payments
We operate a number of equity-settled share-based payment arrangements, under which we receive services from employees in
consideration for equity instruments (share options and shares) of the group. Equity-settled share-based payments are measured at
fair value at the date of grant. Market-based performance criteria and non-vesting conditions (for example, the requirement for
employees to make contributions to the share purchase programme) are reflected in this measurement of fair value. The fair value
determined at the grant date is recognised as an expense on a straight line basis over the vesting period, based on the group’s
estimate of the options or shares that will eventually vest and adjusted for the effect of non market-based vesting conditions. Fair
value is measured using either the Binomial options pricing model or Monte Carlo simulations, whichever is more appropriate to the
share-based payment arrangement.
Service and performance conditions are vesting conditions. Any other conditions are non-vesting conditions which have to be taken
into account to determine the fair value of equity instruments granted. In the case that an award or option does not vest as a result
of a failure to meet a non-vesting condition that is within the control of either counterparty, this is accounted for as a cancellation.
Cancellations are treated as accelerated vesting and all remaining future charges are immediately recognised in the income
statement. As the requirement to save under an employee saveshare arrangement is a non-vesting condition, employee
cancellations, other than through a termination of service, are treated as an accelerated vesting.
No adjustment is made to total equity for awards that lapse or are forfeited after the vesting date.
Year ended 31 March
2019
£m
2018
£m
2017
£m
Employee Saveshare Plans 38 42 40
Executive Share Plans:
Incentive Share Plan (ISP) 616–
Deferred Bonus Plan (DBP) 649
Retention Share Plan (RSP) 17 21 8
Other plans –1–
67 84 57
What share incentive arrangements do we have?
Our plans include savings-related share option plans for employees and those of participating subsidiaries, further share option plans for
selected employees and a stock purchase plan for employees in the US. We also have several share plans for executives. All share-based
payment plans are equity-settled. Details of these plans is set out below.

156
BT Group plc Annual Report 2019
Notes to the consolidated financial statements continued
22. Share-based payments continued
Employee Saveshare Plans
Under an HMRC-approved savings-related share option plan, employees save on a monthly basis, over a three or five-year period,
towards the purchase of shares at a fixed price determined when the option is granted. This price is usually set at a 20% discount to the
market price for five-year plans and 10% for three-year plans. The options must be exercised within six months of maturity of the
savings contract, otherwise they lapse. Similar plans operate for our overseas employees.
Incentive Share Plan (ISP)
Under the ISP, participants are entitled to these shares in full at the end of a three-year period only if the company has met the relevant
pre-determined corporate performance measures and if the participants are still employed by the group. For ISP awards granted in
2018/19, 2017/18 and 2016/17: 40% of each award is linked to a total shareholder return (TSR) target for a comparator group of
companies from the beginning of the relevant performance period; 40% is linked to a three-year cumulative normalised free cash flow
measure; and 20% to growth in underlying revenue excluding transit.
Deferred Bonus Plan (DBP)
Under the DBP, awards are granted annually to selected employees. Shares in the company are transferred to participants at the end of
three years if they continue to be employed by the group throughout that period.
Retention Share Plan (RSP)
Under the RSP, awards are granted to selected employees. Shares in the company are transferred to participants at the end of a
specified retention period if they continue to be employed by the group throughout that period.
Under the terms of the ISP, DBP and RSP, dividends or dividend equivalents earned on shares during the conditional periods are
reinvested in company shares for the potential benefit of the participants.
Employee Saveshare Plans
Movements in Employee Saveshare options are shown below.
Movement in the number of share
options Weighted average exercise price
Year ended 31 March
2019
millions
2018
millions
2017
millions
2019
pence
2018
pence
2017
pence
Outstanding at 1 April 175 189 197 306 313 287
Granted 80 69 44 175 250 362
Forfeited (44) (41) (18) 298 328 345
Exercised (1) (30) (33) 247 169 208
Expired (20) (12) (1) 294 353 345
Outstanding at 31 March 190 175 189 254 306 313
Exercisable at 31 March – ––249 320 237
The weighted average share price for all options exercised during 2018/19 was 249p (2017/18: 311p, 2016/17: 357p).
The following table summarises information relating to options outstanding and exercisable under Employee Saveshare plans at
31 March 2019.
Normal dates of vesting and exercise (based on calendar years)
Exercise price
per share
Weighted
average
exercise
price
Number of
outstanding
options
millions
Weighted
average
remaining
contractual life
2019 319p – 397p 333p 40 10 months
2020 243p – 376p 305p 34 22 months
2021 170p – 353p 232p 43 34 months
2022 243p 243p 29 46 months
2023 170p 170p 43 58 months
Total 254p 189 34 months

BT Group plc Annual Report 2019
157
Strategic report
Governance
Financial statements
Additional information
22. Share-based payments continued
Executive share plans
Movements in executive share plan awards during 2018/19 are shown below:
Number of shares (millions)
ISP DBP RSP Total
At 31 March 2018 54 61272
Awards granted 334744
Awards vested – (1) (7) (8)
Awards lapsed (18) (1) (1) (20)
Dividend shares reinvested 5––5
At 31 March 2019 74 81193
Fair values
The following table summarises the fair values and key assumptions used for valuing grants made under the Employee Saveshare plans
and ISP in 2018/19, 2017/18 and 2016/17.
2019 2018 2017
Year ended 31 March
Employee
Saveshare ISP
Employee
Saveshare ISP
Employee
Saveshare ISP
Weighted average fair value 41p 156p 56p 202p 72p 328p
Weighted average share price 208p 211p 296p 281p 422p 426p
Weighted average exercise price of options granted 175p n/a 250p n/a 362p n/a
Expected dividend yield 3.47% – 3.83% n/a 3.12% – 3.21% n/a 2.9% – 3.4% n/a
Risk free rates 0.74% – 1.07% 0.7% 0.1% – 0.2% 0.2% 0.5% – 0.8% 0.6%
Expected volatility 23.3% – 25.8% 23.5% 23.1% – 24.3% 23.6% 19.0% – 21.5% 21.8%
Employee Saveshare grants are valued using a Binomial options pricing model. Awards under the ISP are valued using Monte Carlo
simulations. TSRs are generated for BT and the comparator group at the end of the three-year performance period, using each
company’s volatility and the cross correlation between pairs of stocks.
Volatility has been determined by reference to BT’s historical volatility which is expected to reflect the BT share price in the future. An
expected life of three months after vesting date is assumed for Employee Saveshare options. For all other awards the expected life is
equal to the vesting period. The risk-free interest rate is based on the UK gilt curve in effect at the time of the grant, for the expected
life of the option or award.
The fair values for the DBP and RSP were determined using the market price of the shares at the grant date. The weighted average share
price for DBP awards granted in 2018/19 was 209p (2017/18: 282p, 2016/17: 421p) and for RSP awards granted in 2018/19 217p
(2017/18: 282p, 2016/17: 417p).
23. Investments
Significant accounting policies that apply to investments
Investments classified as amortised cost
These investments are measured at amortised cost. Any gain or loss on derecognition is recognised in the income statement.
Investments classified as fair value through profit and loss
These investments are initially recognised at fair value plus direct transaction costs. They are re-measured at subsequent reporting
dates to fair value and changes are recognised directly in the income statement.
Debt instruments classified as fair value through other comprehensive income
These investments are initially recognised at fair value plus direct transaction costs. Investments are re-measured at subsequent
reporting dates to fair value, and unrealised gains and losses are recognised in other comprehensive income (except for changes in
exchange rates for monetary items, interest, and impairment losses, which are recognised in the income statement). On
derecognition of the investment, the cumulative gain or loss previously recognised in other comprehensive income is taken to the
income statement, in the line that most appropriately reflects the nature of the item or transaction.
Equity instruments classified as fair value through other comprehensive income
We have made an irrevocable election to present changes in the fair value of equity investments that are not held for trading in other
comprehensive income. All gains or losses are recognised in other comprehensive income and are not reclassified to the income statement
when the investments are disposed of, aside from dividends which are recognised in the income statement when our right to receive
payment is established. Equity investments are recorded in non-current assets unless they are expected to be sold within one year.

158
BT Group plc Annual Report 2019
Notes to the consolidated financial statements continued
23. Investments continued
IFRS 9 was applied for the first time on 1 April 2018 and introduces new classifications for financial instruments, including investments.
Under IAS 39, we classified investments as available-for-sale, loans and receivables, and fair value through profit or loss. On transition
to IFRS 9 we have reclassified them as fair value through other comprehensive income, fair value through profit or loss, and amortised
cost, as set out in note 1. The current year figures in the following table reflect the classifications under IFRS 9, and the prior year
figures reflect the previous classifications under IAS 39.
At 31 March
2019
£m
2018
£m
2017
£m
Non-current assets
Fair value through other comprehensive income 48 – –
Available-for-sale –4637
Fair value through profit or loss 677
54 53 44
Current assets
Fair value through other comprehensive income – – –
Available-for-sale – 2,575 1,437
Investments held at amortised cost 3,214 – –
Loans and receivables – 447 83
3,214 3,022 1,520
Investments held at amortised cost consist of investments previously classified as loans and receivables and relate to money market
investments denominated in sterling of £2,687m (2017/18: £416m, 2016/17: £35m), in US dollars of £26m (2017/18: £27m,
2016/17: £30m) in euros of £499m (2017/18: £nil, 2016/17: £nil) and in other currencies £2m (2017/18: £4m, 2016/17: £18m).
They also include investments in liquidity funds of £2,522m (2017/18: £2,575m, 2016/17: £1,437m) held to collect contractual
cash flows. In prior years these were classified as available-for-sale.
Fair value estimation
Fair value hierarchy
At 31 March 2019
Level 1
£m
Level 2
£m
Level 3
£m
Total held at
fair value
£m
Non-current and current investments
Fair value through other comprehensive income 38 – 10 48
Fair value through profit or loss 6 – – 6
Total 44 – 10 54
At 31 March 2018
Level 1
£m
Level 2
£m
Level 3
£m
Total held at
fair value
£m
Non-current and current investments
Available-for-sale 32 2,575 14 2,621
Fair value through profit or loss 7 – – 7
Total 39 2,575 14 2,628
At 31 March 2017
Level 1
£m
Level 2
£m
Level 3
£m
Total held at
fair value
£m
Non-current and current investments
Available-for-sale 21 1,437 16 1,474
Fair value through profit or loss 7 – – 7
Total 28 1,437 16 1,481
The three levels of valuation methodology used are:
Level 1 – uses quoted prices in active markets for identical assets or liabilities.
Level 2 – uses inputs for the asset or liability other than quoted prices that are observable either directly or indirectly.
Level 3 – uses inputs for the asset or liability that are not based on observable market data, such as internal models
or other valuation methods.

BT Group plc Annual Report 2019
159
Strategic report
Governance
Financial statements
Additional information
23. Investments continued
Level 2 balances disclosed in prior years consist of investments classified as available-for-sale and relating to liquidity funds
denominated in sterling of £2,180m (2017/18) and £900m (2016/17), and in euros of £395m (2017/18) and £537m (2016/17).
Their fair value was calculated by using notional currency amounts adjusted by year end spot exchange rates. These have been
reclassified on adoption of IFRS 9 and are now held at amortised cost.
Level 3 balances consist of investments classified as fair value through other comprehensive income (previously available-for-sale) of
£10m (2017/18: £14m, 2016/17: £16m) which represent investments in a number of private companies. In the absence of specific
market data, these investments are held at cost, adjusted as necessary for impairments, which approximates to fair value.
24. Cash and cash equivalents
Significant accounting policies that apply to cash and cash equivalents
Cash and cash equivalents comprise cash in hand and current balances with banks and similar institutions, which are readily
convertible to cash and are subject to insignificant risk of changes in value and have an original maturity of three months or less. All
are held at amortised cost on the balance sheet, equating to fair value.
For the purpose of the consolidated cash flow statement, cash and cash equivalents are as defined above net of outstanding bank
overdrafts. Bank overdrafts are included within the current element of loans and other borrowings (note 25).
IFRS 9 was applied for the first time on 1 April 2018 and introduces new classifications for financial instruments. Cash and cash
equivalents were classified as loans and receivables under IAS 39, and are now classified as financial assets held at amortised cost under
IFRS 9. This has not had an impact on the accounting for these instruments, or on their carrying amounts.
At 31 March
2019
£m
2018
£m
2017
£m
Cash at bank and in hand 495 446 469
Cash equivalents
US deposits 32632
UK deposits 1,132 31 1
Other deposits 36 25 26
Total cash equivalents 1,171 82 59
Total cash and cash equivalents 1,666 528 528
Bank overdrafts (note 25) (72) (29) (17)
Cash and cash equivalents per the cash flow statement 1,594 499 511
Cash and cash equivalents include restricted cash of £44m (2017/18: £32m, 2016/17: £43m), of which £40m (2017/18: £29m,
2016/17: £41m) was held in countries where local capital or exchange controls currently prevent us from accessing cash balances.
The remaining balance of £4m (2017/18: £3m, 2016/17: £2m) was held in escrow accounts, or in commercial arrangements
akin to escrow.
25. Loans and other borrowings
Significant accounting policies that apply to loans and other borrowings
We initially recognise loans and other borrowings at the fair value of amounts received net of transaction costs. They are
subsequently measured at amortised cost using the effective interest method and, if included in a fair value hedge relationship, are
re-valued to reflect the fair value movements on the associated hedged risk. The resulting amortisation of fair value movements, on
de-designation of the hedge, is recognised in the income statement.
What’s our capital management policy?
The objective of our capital management policy is to target an overall level of debt consistent with our credit rating target while
investing in the business, supporting the pension scheme and paying dividends. In order to meet this objective, we may issue or repay
debt, issue new shares, repurchase shares, or adjust the amount of dividends paid to shareholders. We manage the capital structure and
make adjustments to it in the light of changes in economic conditions and the risk characteristics of the group. The Board regularly
reviews the capital structure. No changes were made to these objectives and processes during 2018/19, 2017/18 or 2016/17. For
details of share issues and repurchases in the year see note 21.
Our capital structure consists of net debt and shareholders’ equity. The analysis below summarises the components which we manage as
capital.
At 31 March
2019
£m
2018
£m
2017
£m
Net debt 11,035 9,627 8,932
Total parent shareholders’ equity
a
10,140 9,877 8,305
21,175 19,504 17,237
a
Excludes non-controlling interests of £27m (2017/18: £34m, 2016/17: £30m). 2017/18 parent shareholders’ equity has been restated to reflect the update to the calculation of our IAS 19
accounting valuation of retirement benefit obligations, refer to note 2.

160
BT Group plc Annual Report 2019
Notes to the consolidated financial statements continued
25. Loans and other borrowings continued
Net debt
Net debt consists of loans and other borrowings (both current and non-current), less current asset investments and cash and cash
equivalents. Loans and other borrowings are measured at the net proceeds raised, adjusted to amortise any discount over the term of
the debt. For the purpose of this measure, current asset investments and cash and cash equivalents are measured at the lower of cost
and net realisable value. Currency denominated balances within net debt are translated to sterling at swapped rates where hedged.
Net debt is considered to be an alternative performance measure as it is not defined in IFRS. The most directly comparable IFRS measure
is the aggregate of loans and other borrowings (current and non-current), current asset investments and cash and cash equivalents.
A reconciliation from the most directly comparable IFRS measure to net debt is given below.
At 31 March
2019
£m
2018
£m
2017
£m
Loans and other borrowings 16,876 14,275 12,713
Less:
Cash and cash equivalents (1,666) (528) (528)
Current asset investments (3,214) (3,022) (1,520)
11,996 10,725 10,665
Adjustments:
To retranslate debt balances at swap rates where hedged by currency swaps (701) (874) (1,419)
To remove accrued interest applied to reflect the effective interest method and fair value adjustments (260) (224) (314)
Net debt 11,035 9,627 8,932
The table below shows the key components of net debt and of the increase of £1,408m this year.
At
1 April
2018
£m
Issuance/
(maturities)
£m
Fair value
movements
£m
Foreign
exchange
£m
Transfer
to within
one year
£m
Accrued
interest
movements
£m
At
31 March
2019
£m
Debt due within one year
a
2,281 (1,423) (8) (97) 1,281 66 2,100
Debt due after one year 11,994 3,972 (11) (102) (1,111) 34 14,776
Cash flows from derivatives related to net debt – 124 – – (124) – –
Overdrafts – 46 – – (46) – –
Impact of cross-currency swaps
b
(874) – – 182 – (9) (701)
Removal of the accrued interest and fair value
adjustments
c
(226) – 19 – – (56) (263)
Gross debt 13,175 2,719 – (17) – 35 15,912
Less:
Cash and cash equivalents (528) (1,140) – (3) – 5 (1,666)
Current asset investments (3,022) (203) – 11 – – (3,214)
Removal of the accrued interest
c
2––––13
Net debt 9,627 1,376 – (9) – 41 11,035
a
Including accrued interest and bank overdrafts.
b
Translation of debt balances at swap rates where hedged by cross currency swaps.
c
Removal of accrued interest applied to reflect the effective interest rate method and removal of fair value adjustments.

BT Group plc Annual Report 2019
161
Strategic report
Governance
Financial statements
Additional information
25. Loans and other borrowings continued
The table below gives details of the listed bonds and other debt.
At 31 March
2019
£m
2018
£m
2017
£m
6.625% £500m bond due June 2017
a
– – 526
5.95% US$1,100m bond due January 2018
a
– – 891
3.25% €600m bond due August 2018
a
– 541 539
2.35% US$800m bond due February 2019
a
– 572 642
4.38% £450m bond due March 2019 – 455 460
1.125% €1,000m bond due June 2019
a
869 883 863
8.625% £300m bond due March 2020 300 300 300
0.625% €1,500m bond due March 2021
a
1,289 1,309 1,282
0.5% €575m bond due June 2022
a
495 502 –
1.125% €1,100m bond due March 2023
a
946 961 942
0.875% €500m bond due September 2023
a
430––
4.5% US$675m bond due December 2023
a
524––
1% €575m bond due June 2024
a
498 506 –
1% €1,100m bond due November 2024
a
943 959 –
3.50% £250m index linked bond due April 2025 433 419 403
1.75% €1,300m bond due March 2026
a
1,118 1,137 1,113
1.5% €1,150m bond due June 2027
a
993 1,009 –
2.125% €500m bond due September 2028
a
433––
5.125% US$700m bond due December 2028
a
542––
5.75% £600m bond due December 2028 710 721 731
9.625% US$2,670m bond due December 2030
a
(minimum 8.625%
b
) 2,096 1,943 2,191
3.125% £500m bond due November 2031 502 502 –
3.64% £330m bond due June 2033 339––
1.613% £330m index linked bond due June 2033 340 – –
6.375% £500m bond due June 2037
a
522 522 522
3.883% £330m bond due June 2039 340 – –
1.739% £330m index linked bond due June 2039 340 – –
3.924% £340m bond due June 2042 350 – –
1.774% £340m index linked bond due June 2042 351 – –
3.625% £250m bond due November 2047 250 250 –
Total listed bonds 15,953 13,491 11,405
Finance leases 206 223 229
2.21% £350m bank loan due December 2017 – – 352
Other loans 645 532 710
Bank overdrafts (note 24) 72 29 17
Total other loans and borrowings 717 561 1,079
Total loans and other borrowings 16,876 14,275 12,713
a
Designated in a cash flow hedge relationship.
b
The interest rate payable on this bond attracts an additional 0.25% for a downgrade by one credit rating by either Moody’s or Standard & Poor’s to the group’s senior unsecured debt below A3/A–
respectively. In addition, if Moody’s or Standard & Poor’s subsequently increase the ratings then the interest rate will be decreased by 0.25% for each rating category upgrade by each rating agency. In
no event will the interest rate be reduced below the minimum rate reflected in the above table.
Unless previously designated in a fair value hedge relationship, all loans and other borrowings are carried on our balance sheet and in
the table above at amortised cost. The fair value of listed bonds and other long-term borrowings is £17,785m (2017/18: £14,878m,
2016/17: £13,496m) and the fair value of finance leases is £251m (2017/18: £253m, 2016/17: £273m).
The fair value of our bonds and other long-term borrowings is estimated on the basis of quoted market prices (Level 1), or based on
similar issuances where they exist (Level 2).
The carrying amount of other loans and bank overdrafts equates to fair value due to the short maturity of these items (Level 3).
The interest rates payable on loans and borrowings disclosed above reflect the coupons on the underlying issued loans and borrowings
and not the interest rates achieved through applying associated cross-currency and interest rate swaps in hedge arrangements.

162
BT Group plc Annual Report 2019
Notes to the consolidated financial statements continued
25. Loans and other borrowings continued
Loans and other borrowings are analysed as follows:
At 31 March
2019
£m
2018
£m
2017
£m
Current liabilities
Listed bonds 1,367 1,702 1,539
Finance leases 16 18 15
Bank loans – – 352
Other loans and bank overdrafts
a
717 561 726
Total current liabilities 2,100 2,281 2,632
Non-current liabilities
Listed bonds 14,586 11,789 9,866
Finance leases 190 205 214
Other loans ––1
Total non-current liabilities 14,776 11,994 10,081
Total 16,876 14,275 12,713
a
Includes collateral received on swaps of £638m (2017/18: £525m, 2016/17: £702m).
The carrying values disclosed in the above table reflect balances at amortised cost adjusted for accrued interest and fair value
adjustments to the relevant loans or borrowings. These do not reflect the final principal repayments that will arise after taking account
of the relevant derivatives in hedging relationships which are reflected in the table below. Apart from finance leases, all borrowings as at
31 March 2019, 2018 and 2017 were unsecured.
The principal repayments of loans and borrowings at hedged rates amounted to £15,912m (2017/18: £13,175m, 2016/17:
£10,980m) and repayments fall due as follows:
2019 2018 2017
At 31 March
Carrying
amount
£m
Effect of
hedging
and
interest
£m
Principal
repayments
at hedged
rates
£m
Carrying
amount
£m
Effect of
hedging
and
interest
£m
Principal
repayments
at hedged
rates
£m
Carrying
amount
£m
Effect of
hedging
and
interest
£m
Principal
repayments
at hedged
rates
£m
Within one year, or on demand 2,100 (264) 1,836 2,272 (291) 1,981 2,632 (498) 2,134
Between one and two years 1,309 (133) 1,176 1,192 (66) 1,126 1,614 (197) 1,417
Between two and three years 15 – 15 1,332 (154) 1,178 1,166 (43) 1,123
Between three and four years 1,463 (89) 1,374 18 – 18 1,295 (121) 1,174
Between four and five years 964 33 997 1,489 (111) 1,378 12 – 12
After five years 10,975 (461) 10,514 7,899 (405) 7,494 5,844 (724) 5,120
Total due for repayment after
more than one year 14,726 (650) 14,076 11,930 (736) 11,194 9,931 (1,085) 8,846
Total repayments 16,826 (914) 15,912 14,202 (1,027) 13,175 12,563 (1,583) 10,980
Fair value adjustments 50 73 150
Total loans and other
borrowings 16,876 14,275 12,713
Obligations under finance leases are analysed as follows:
2019 2018 2017 2019 2018 2017
Minimum lease payments
Repayment of outstanding
lease obligations
At 31 March £m £m £m £m £m £m
Amounts payable under finance leases:
Due within one year 29 33 29 16 18 14
Between two to five years 109 122 102 66 71 50
After five years 159 193 237 120 130 165
297 348 368 202 219 229
Less: future finance charges (95) (129) (139) – – –
Fair value adjustments for purchase price adjustment 4 4 – 4 4 –
Total finance lease obligations 206 223 229 206 223 229
Assets held under finance leases mainly consist of buildings and network assets. Our obligations under finance leases are secured by the
lessors’ title to the leased assets.

BT Group plc Annual Report 2019
163
Strategic report
Governance
Financial statements
Additional information
26. Finance expense
Year ended 31 March
2019
£m
2018
£m
2017
£m
Finance expense
Interest on:
Financial liabilities at amortised cost and associated derivatives 582 478 567
Finance leases 13 16 15
Derivatives –1412
Fair value movements on derivatives not in a designated hedge relationship (3) 1 (2)
Reclassification of cash flow hedge from other comprehensive income 45 34 (1)
Unwinding of discount on provisions 14 15 16
Total finance expense before specific items 651 558 607
Specific items (note 10) 139 218 210
Total finance expense 790 776 817
Reconciliation of net finance expense to net interest cash outflow
Net interest cash outflow of £508m (2017/18: £548m, 2016/17: £622m) is £109m lower (2017/18: £2m higher, 2016/17: £28m
higher) than the net finance expense in the income statement.
Year ended 31 March
2019
£m
2018
£m
2017
£m
Finance expense before specific items 651 558 607
Finance income before specific items (34) (12) (13)
Net finance expense before specific items 617 546 594
Timing differences:
Derivative restructuring costs ––1
Timing of coupon payments on bonds (85) (6) 19
Deferred income 888
Principal uplift on CPI and RPI linked bonds (32) – –
Net interest cash outflow 508 548 622
27. Financial instruments and risk management
We issue or hold financial instruments mainly to finance our operations; to finance corporate transactions such as dividends, share
buybacks and acquisitions; for the temporary investment of short-term funds; and to manage currency and interest rate risks. In
addition, various financial instruments, for example trade receivables and payables arise directly from operations.
How do we manage financial risk?
Our activities expose us to a variety of financial risks: market risk (including interest rate risk and foreign exchange risk), credit risk and
liquidity risk.
Treasury operation
We have a centralised treasury operation whose primary role is to manage liquidity and funding requirements as well as our exposure to
associated market risks, and credit risk.
Treasury policy
Treasury policy is set by the Board. Group treasury activities are subject to a set of controls appropriate for the magnitude of borrowing,
investments and group-wide exposures. The Board has delegated authority to operate these policies to a series of panels responsible for
the management of key treasury risks and operations. Appointment to and removal from the key panels requires approval from two of
the following: the chairman, the chief executive or the chief financial officer.
There has been no change in the nature of our risk profile between 31 March 2019 and the date of approval of these financial
statements.
How do we manage interest rate risk?
Management policy
Interest rate risk arises primarily from our long-term borrowings. Interest cash flow risk arises from borrowings issued at variable rates,
partially offset by cash held at variable rates. Fair value interest rate risk arises from borrowings issued at fixed rates.
Our policy, as set by the Board, is to ensure that at least 70% of ongoing net debt is at fixed rates. Short-term interest rate
management is delegated to the treasury operation while long-term interest rate management decisions require further approval by
the chief financial officer, group director tax, treasury, insurance and pensions or the treasury director who each have been delegated
such authority from the Board.
Hedging strategy
In order to manage our interest rate profile, we have entered into cross-currency and interest rate swap agreements to vary the
amounts and periods for which interest rates on borrowings are fixed. The duration of the swap agreements matches the duration of the
debt instruments. The majority of the group’s long-term borrowings are subject to fixed sterling interest rates after applying the impact
of these hedging instruments.

164
BT Group plc Annual Report 2019
Notes to the consolidated financial statements continued
27. Financial instruments and risk management continued
How do we manage foreign exchange risk?
Management policy
Foreign currency hedging activities protect the group from the risk that changes in exchange rates will adversely affect future net cash
flows.
The Board’s policy for foreign exchange risk management defines the types of transactions typically covered, including significant
operational, funding and currency interest exposures, and the period over which cover should extend for each type of transaction.
The Board has delegated short-term foreign exchange management to the treasury operation and long-term foreign exchange
management decisions require further approval from the chief financial officer, group director tax, treasury, insurance and pensions or
the treasury director.
Hedging strategy
A significant proportion of our external revenue and costs arise within the UK and are denominated in sterling. Our non-UK operations
generally trade and are funded in their functional currency which limits their exposure to foreign exchange volatility.
We enter into forward currency contracts to hedge foreign currency capital purchases, purchase and sale commitments, interest
expense and foreign currency investments. The commitments hedged are principally denominated in US dollar, euro and Asia Pacific
region currencies. As a result, our exposure to foreign currency arises mainly on non-UK subsidiary investments and on residual currency
trading flows. We use cross-currency swaps to swap foreign currency borrowings into sterling.
The table below reflects the currency and interest rate profile of our loans and borrowings after the impact of hedging.
2019 2018 2017
At 31 March
Fixed rate
interest
£m
Floating
rate
interest
£m
Total
£m
Fixed rate
interest
£m
Floating
rate
interest
£m
Total
£m
Fixed rate
interest
£m
Floating
rate
interest
£m
Total
£m
Sterling 13,556 1,767 15,323 11,990 676 12,666 9,633 706 10,339
Euro – 589 589 – 509 509 – 641 641
Total 13,556 2,356 15,912 11,990 1,185 13,175 9,633 1,347 10,980
Ratio of fixed to floating 85% 15% 100% 91% 9% 100% 88% 12% 100%
Weighted average effective
fixed interest rate – sterling 4.0% 4.4% 4.9%
The floating rate loans and borrowings bear interest rates fixed in advance for periods ranging from one day to one year, primarily by
reference to LIBOR quoted rates, RPI and CPI.
Sensitivity analysis
The income statement and shareholders’ equity are exposed to volatility arising from changes in interest rates and foreign exchange
rates. To demonstrate this volatility, management has concluded that the following are reasonable benchmarks for performing
sensitivity analysis:
• For interest, a 1% increase in interest rates and parallel shift in yield curves across sterling, US dollar and euro currencies.
• For foreign exchange, a 10% strengthening/weakening of sterling against other currencies.
The impact on equity, before tax and excluding any impact related to retirement benefit plans, of a 1% increase in interest rates and a
10% strengthening of sterling against other currencies is as detailed below:
At 31 March
2019
£m
Increase
(reduce)
2018
£m
Increase
(reduce)
2017
£m
Increase
(reduce)
Sterling interest rates 672 628 554
US dollar interest rates (350) (267) (348)
Euro interest rates (399) (401) (229)
Sterling strengthening (219) (236) (269)
A 1% decrease in interest rates and 10% weakening in sterling against other currencies would have broadly the same impact in the
opposite direction.

BT Group plc Annual Report 2019
165
Strategic report
Governance
Financial statements
Additional information
27. Financial instruments and risk management continued
The impact of a 1% change in interest rates on the group’s annual net finance expense and our exposure to foreign exchange volatility
in the income statement, after hedging, (excluding translation exposures) would not have been material in 2018/19, 2017/18 and
2016/17.
Credit ratings
We continue to target a BBB+/Baa1 credit rating over the cycle. We regularly review the liquidity of the group and our funding strategy
takes account of medium-term requirements. These include the pension deficit and shareholder distributions.
Our December 2030 bond contains covenants which require us to pay higher rates of interest since our credit ratings fell below A3 in
the case of Moody’s or A– in the case of Standard & Poor’s (S&P). Additional interest of 0.25% per year accrues for each ratings
category downgrade by each agency below those levels effective from the next coupon date following a downgrade. Based on the total
notional value of debt outstanding of £2.0bn at 31 March 2019, our finance expense would increase/decrease by approximately £10m
a year if the group’s credit rating were to be downgraded/upgraded, respectively, by one credit rating category by both agencies.
Our credit ratings were as detailed below:
2019 2018 2017
At 31 March Rating Outlook Rating Outlook Rating Outlook
Rating agency
Moody’s Baa2 Stable Baa2 Stable Baa1 Negative
Standard & Poor’s BBB Stable BBB+ Negative BBB+ Negative
How do we manage liquidity risk?
Management policy
We maintain liquidity by entering into short and long-term financial instruments to support operational and other funding
requirements, determined using short and long-term cash forecasts. These forecasts are supplemented by a financial headroom analysis
which is used to assess funding adequacy for at least a 12-month period. On at least an annual basis the Board reviews and approves the
long-term funding requirements of the group and on an ongoing basis considers any related matters. We manage refinancing risk by
limiting the amount of borrowing that matures within any specified period and having appropriate strategies in place to manage
refinancing needs as they arise. The maturity profile of our loans and borrowings at 31 March 2019 is disclosed in note 25. We have
term debt maturities of £1.2bn in 2019/20.
Our treasury operation reviews and manages our short-term requirements within the parameters of the policies set by the Board. We
hold cash, cash equivalents and current investments in order to manage short-term liquidity requirements. At 31 March 2019 we had
undrawn committed borrowing facilities of £2.1bn (2017/18: £2.1bn, 2016/17: £2.1bn) maturing in September 2021.
In the UK, the group has arranged for funders to offer a supplier financing scheme to the group’s suppliers. This enables suppliers who
sign up to the arrangements to sell their invoices to the funders and to be paid earlier than the invoice due date. The group assesses the
arrangement against indicators to assess if debts which vendors have sold to the funder under the supplier financing scheme continue
to meet the definition of trade payables or should be classified as borrowings. At 31 March 2019 the payables met the criteria of trade
payables.
Maturity analysis
The following table provides an analysis of the remaining contractually-agreed cash flows including interest payable for our non-
derivative financial liabilities on an undiscounted basis, which therefore differs from both the carrying value and fair value.
Non-derivative financial liabilities
At 31 March 2019
Loans and
other
borrowings
£m
Interest on
loans
and other
borrowings
£m
Trade and
other
payables
£m
Provisions
£m
Total
£m
Due within one year 1,886 541 5,158 39 7,624
Between one and two years 1,309 505 – 33 1,847
Between two and three years 15 497 – 35 547
Between three and four years 1,463 496 – 14 1,973
Between four and five years 964 482 – 12 1,458
After five years 10,975 3,543 – 127 14,645
16,612 6,064 5,158 260 28,094
Interest payments not yet accrued – (5,850) – – (5,850)
Fair value adjustment 50 – – – 50
Impact of discounting – – – (29) (29)
Carrying value on the balance sheet
a,b
16,662 214 5,158 231 22,265

166
BT Group plc Annual Report 2019
Notes to the consolidated financial statements continued
27. Financial instruments and risk management continued
Non-derivative financial liabilities
At 31 March 2018
Loans and
other
borrowings
£m
Interest on
loans
and other
borrowings
£m
Trade and
other
payables
£m
Provisions
£m
Total
£m
Due within one year 2,120 452 4,939 54 7,565
Between one and two years 1,192 404 – 34 1,630
Between two and three years 1,332 365 – 25 1,722
Between three and four years 18 357 – 43 418
Between four and five years 1,489 355 – 19 1,863
After five years 7,899 2,714 – 197 10,810
14,050 4,647 4,939 372 24,008
Interest payments not yet accrued – (4,495) – – (4,495)
Fair value adjustment 73 – – – 73
Impact of discounting – – – (72) (72)
Carrying value on the balance sheet
a,b
14,123 152 4,939 300 19,514
Non-derivative financial liabilities
At 31 March 2017
Loans
and other
borrowings
£m
Interest on
loans
and other
borrowings
£m
Trade
and other
payables
£m
Provisions
£m
Total
£m
Due within one year 2,468 507 5,259 62 8,296
Between one and two years 1,614 415 – 41 2,070
Between two and three years 1,166 364 – 21 1,551
Between three and four years 1,295 327 – 18 1,640
Between four and five years 12 319 – 17 348
After five years 5,844 2,726 – 310 8,880
12,399 4,658 5,259 469 22,785
Interest payments not yet accrued – (4,494) – – (4,494)
Fair value adjustment 150 – – – 150
Impact of discounting – – – (177) (177)
Carrying value on the balance sheet
a,b
12,549 164 5,259 292 18,264
a
Foreign currency-related cash flows were translated at closing rates as at the relevant reporting date. Future variable interest rate cash flows were calculated using the most recent rate applied at the
relevant balance sheet date.
b
The carrying amount of trade and other payables excludes £1,479m (2017/18: £1,326m, 2016/17: £1,298m) of non-current trade and other payables which relates to non-financial liabilities, and
£632m (2017/18: £2,229m, 2016/17: £2,178m) of other taxation and social security and deferred income.
Trade and other payables are held at amortised cost. The carrying amount of these balances approximates to fair value due to the short
maturity of amounts payable.
The following table provides an analysis of the contractually agreed cash flows in respect of the group’s derivative financial instruments.
Cash flows are presented on a net or gross basis in accordance with the settlement arrangements of the instruments.
Derivatives – Analysed by earliest payment date
a
Derivatives – Analysed based on holding instrument to maturity
Derivative financial liabilities
At 31 March 2019
Net settled
£m
Gross settled
outflows
£m
Gross settled
inflows
£m
Total
£m
Net settled
£m
Gross settled
outflows
£m
Gross settled
inflows
£m
Total
£m
Due within one year 167 1,007 (950) 224 82 1,007 (950) 139
Between one and two years 128 541 (489) 180 77 541 (489) 129
Between two and three years 131 131 (96) 166 71 131 (96) 106
Between three and four years 163 633 (591) 205 71 633 (591) 113
Between four and five years 207 1,095 (1,042) 260 71 1,095 (1,042) 124
After five years 43 3,790 (3,660) 173 467 3,790 (3,660) 597
Total
b
839 7,197 (6,828) 1,208 839 7,197 (6,828) 1,208
Derivatives – Analysed by earliest payment date
a
Derivatives – Analysed based on holding instrument to maturity
Derivative financial liabilities
At 31 March 2018
Net settled
£m
Gross settled
outflows
£m
Gross settled
inflows
£m
Total
£m
Net settled
£m
Gross settled
outflows
£m
Gross settled
inflows
£m
Total
£m
Due within one year 140 587 (547) 180 91 587 (547) 131
Between one and two years 135 183 (166) 152 91 183 (166) 108
Between two and three years 156 442 (446) 152 85 69 (47) 107
Between three and four years 143 52 (29) 166 80 68 (47) 101
Between four and five years 161 52 (29) 184 80 68 (47) 101
After five years 291 2,234 (2,149) 376 599 2,575 (2,512) 662
Total
b
1,026 3,550 (3,366) 1,210 1,026 3,550 (3,366) 1,210

BT Group plc Annual Report 2019
167
Strategic report
Governance
Financial statements
Additional information
27. Financial instruments and risk management continued
Derivatives – Analysed by earliest payment date
a
Derivatives –Analysed based on holding instrument to maturity
Derivative financial liabilities
At 31 March 2017
Net settled
£m
Gross settled
outflows
£m
Gross settled
inflows
£m
Total
£m
Net settled
£m
Gross settled
outflows
£m
Gross settled
inflows
£m
Total
£m
Due within one year 291 582 (576) 297 92 582 (576) 98
Between one and two years 296 1,139 (1,097) 338 92 1,139 (1,097) 134
Between two and three years 198 – – 198 92 – – 92
Between three and four years 114 – – 114 88 – – 88
Between four and five years 104 – – 104 83 – – 83
After five years 123 – – 123 679 – – 679
Total
b
1,126 1,721 (1,673) 1,174 1,126 1,721 (1,673) 1,174
a
Certain derivative financial instruments contain break clauses whereby either the group or bank counterparty can terminate the swap on certain dates and the mark to market position is settled in cash.
b
Foreign currency-related cash flows were translated at closing rates as at the relevant reporting date. Future variable interest rate cash flows were calculated using the most recent rate applied at the
relevant balance sheet date.
How do we manage credit risk?
Management policy
Our exposure to credit risk arises from financial assets transacted by the treasury operation (primarily derivatives, investments, cash and
cash equivalents) and from trading-related receivables.
For treasury-related balances, the Board’s defined policy restricts exposure to any one counterparty by setting credit limits based on the
credit quality as defined by Moody’s and Standard & Poor’s. The minimum credit ratings permitted with counterparties in respect of new
transactions are A3/A– for long-term and P1/A1 for short-term investments. If counterparties in respect of existing transactions fall
below the permitted criteria we will take action where appropriate.
The treasury operation continuously reviews the limits applied to counterparties and will adjust the limit according to the nature and
credit standing of the counterparty, and in response to market conditions, up to the maximum allowable limit set by the Board.
Operational management policy
Our credit policy for trading-related financial assets is applied and managed by each of the customer-facing units to ensure compliance.
The policy requires that the creditworthiness and financial strength of customers are assessed at inception and on an ongoing basis.
Payment terms are set in accordance with industry standards. Where appropriate, we may minimise risks by requesting securities such
as deposits, guarantees and letters of credit. We take proactive steps including constantly reviewing credit ratings of counterparties to
minimise the impact of adverse market conditions on trading-related financial assets.
Exposures
The maximum credit risk exposure of the group’s financial assets at the balance sheet date is as follows:
At 31 March Notes
2019
£m
2018
£m
2017
£m
Derivative financial assets 1,592 1,509 2,246
Investments 23 3,268 3,075 1,564
Trade and other receivables
a
17 1,766 2,518 2,729
Contract assets 6 1,602 – –
Cash and cash equivalents 24 1,666 528 528
9,894 7,630 7,067
a
The carrying amount excludes £445m (2017/18: £317m, 2016/17: £360m) of non-current trade and other receivables which relate to non-financial assets, and £1,456m (2017/18: £1,496m,
2016/17: £1,106m) of prepayments, deferred contract costs and other receivables.
The credit quality and credit concentration of cash equivalents, current asset investments and derivative financial assets are detailed in
the tables below. Where the opinion of Moody’s and Standard & Poor’s (S&P) differ, the lower rating is used.
Moody’s/S&P credit rating of counterparty
2019
£m
2018
£m
2017
£m
Aa2/AA and above 2,522 2,575 1,444
Aa3/AA– 1,376 313 208
A1/A+
a
1,145 651 952
A2/A
a
649 628 370
A3/A–
a
50 180 204
Baa1/BBB+
a
75 59 561
Baa2/BBB and below
a
160 207 86
5,977 4,613 3,825
a
We hold cash collateral of £638m (2017/18: £492m, 2016/17: £702m) in respect of derivative financial assets with certain counterparties.
The concentration of credit risk for our trading balances is provided in note 17, which analyses outstanding balances by customer-
facing unit. Where multiple transactions are undertaken with a single financial counterparty or group of related counterparties, we
enter into netting arrangements to reduce our exposure to credit risk by making use of standard International Swaps and Derivatives
Association (ISDA) documentation. We have also entered into credit support agreements with certain swap counterparties whereby, on
a daily, weekly and monthly basis, the fair value position on notional £3,289m of long dated cross-currency swaps and interest rate
swaps is collateralised. The related net cash inflow during the year was £129m (2017/18: outflow £220m, 2016/17: inflow £100m).
The collateral paid and received is recognised within current asset investments and loans and other borrowings, respectively.

168
BT Group plc Annual Report 2019
Notes to the consolidated financial statements continued
27. Financial instruments and risk management continued
Offsetting of financial instruments
The table below shows our financial assets and liabilities that are subject to offset in the group’s balance sheet and the impact of
enforceable master netting or similar agreements.
Related amounts not set off in the balance sheet
Financial assets and liabilities
At 31 March 2019
Amounts
presented in the
balance sheet
£m
Right of set off
with derivative
counterparties
£m
Cash
collateral
£m
Net
amount
£m
Derivative financial assets 1,592 (802) (638) 152
Derivative financial liabilities (940) 802 90 (48)
Total 652 – (548) 104
Related amounts not set off in the balance sheet
Financial assets and liabilities
At 31 March 2018
Amounts
presented in the
balance sheet
£m
Right of set off
with derivative
counterparties
£m
Cash
collateral
£m
Net
amount
£m
Derivative financial assets 1,509 (754) (492) 263
Derivative financial liabilities (837) 754 60 (23)
Total 672 – (432) 240
Related amounts not set off in the balance sheet
Financial assets and liabilities
At 31 March 2017
Amounts
presented in the
balance sheet
£m
Right of set off
with derivative
counterparties
£m
Cash
collateral
£m
Net
amount
£m
Derivative financial assets 2,246 (693) (702) 851
Derivative financial liabilities (903) 693 64 (146)
Total 1,343 – (638) 705
Derivatives and hedging
We use derivative financial instruments mainly to reduce exposure to foreign exchange and interest rate risks. Derivatives may qualify as
hedges for accounting purposes if they meet the criteria for designation as fair value hedges or cash flow hedges in accordance with
IFRS 9.
Significant accounting policies that apply to derivatives and hedge accounting
All of our derivative financial instruments are held at fair value on the balance sheet.
Derivatives designated in a cash flow hedge
The group designates certain derivatives as cash flow hedges. Where derivatives qualify for hedge accounting, recognition of any
resultant gain or loss depends on the nature of the hedge. To qualify for hedge accounting, hedge documentation must be prepared
at inception, the hedge must be in line with BT’s risk management strategy and there must be an economic relationship based on the
currency, amount and timing of the respective cash flows of the hedging instrument and hedged item. This is assessed at inception
and in subsequent periods in which the hedge remains in operation. Hedge accounting is discontinued when it is no longer in line
with BT’s risk management strategy or if it no longer qualifies for hedge accounting.
When a derivative financial instrument is designated as a hedge of the variability in cash flows of a recognised asset or liability, or a
highly probable transaction, the effective part of any gain or loss on the derivative financial instrument is recognised directly in
equity, in the cash flow reserve. For cash flow hedges of recognised assets or liabilities, the associated cumulative gain or loss is
removed from equity and recognised in the same line of the income statement and in the same period or periods that the hedged
transaction affects the income statement. Any ineffectiveness arising on a cash flow hedge is recognised immediately in the income
statement.
Other derivatives
Our policy is not to use derivatives for trading purposes. However, due to the complex nature of hedge accounting, some derivatives
may not qualify for hedge accounting, or may be specifically not designated as a hedge because natural offset is more appropriate.
These derivatives are classified as fair value through profit and loss and are recognised at fair value. Any direct transaction costs are
recognised immediately in the income statement.
Gains and losses on re-measurement are recognised in the income statement in the line that most appropriately reflects the nature of
the item or transaction to which they relate. Derivative financial instruments are classified as current assets or current liabilities
where they have a maturity period within 12 months. Where derivative financial instruments have a maturity period greater than
12 months, they are classified within either non-current assets or non-current liabilities.

BT Group plc Annual Report 2019
169
Strategic report
Governance
Financial statements
Additional information
27. Financial instruments and risk management continued
Where the fair value of a derivative contract at initial recognition is not supported by observable market data and differs from the
transaction price, a day one gain or loss will arise which is not recognised in the income statement. Such gains and losses are deferred
and amortised to the income statement based on the remaining contractual term and as observable market data becomes available.
The fair values of outstanding swaps and foreign exchange contracts are estimated using discounted cash flow models and market
rates of interest and foreign exchange at the balance sheet date.
At 31 March 2019
Current
asset
£m
Non-current
asset
£m
Current
liability
£m
Non-current
liability
£m
Designated in a cash flow hedge 102 1,228 40 689
Other 9 253 8 203
Total derivatives 111 1,481 48 892
At 31 March 2018
Current
asset
£m
Non-current
asset
£m
Current
liability
£m
Non-current
liability
£m
Designated in a cash flow hedge 187 1,061 41 587
Other 10 251 9 200
Total derivatives 197 1,312 50 787
At 31 March 2017
Current
asset
£m
Non-current
asset
£m
Current
liability
£m
Non-current
liability
£m
Designated in a cash flow hedge 417 1,508 25 616
Other 11 310 9 253
Total derivatives 428 1,818 34 869
All derivative financial instruments are categorised at Level 2 of the fair value hierarchy as defined in note 23.
Instruments designated in a cash flow hedge include interest rate swaps and cross-currency swaps hedging euro- and US dollar-
denominated borrowings. Forward currency contracts are taken out to hedge step-up interest on currency denominated borrowings
relating to the group’s 2030 US dollar bond. The hedged cash flows will affect the group’s income statement as interest and principal
amounts are repaid over the remaining term of the borrowings (see note 25).
We hedge forecast foreign currency purchases, principally denominated in US dollar, euro and Asia Pacific currencies 12 months
forward with certain specific transactions hedged further forward. The related cash flows are recognised in the income statement over
this period.
The amounts related to items designated as hedging instruments were as follows:
Hedged items
At 31 March 2019
Notional
principal
£m
Asset
£m
Liability
£m
Balance in cash
flow hedge
related reserves
(gain)/loss
£m
Fair value
(gain)/loss
recognised
in OCI
£m
Amount
recycled from
cash flow hedge
related
reserves to P&L
£m
Sterling, euro and US dollar denominated borrowings
a
13,518 1,311 (702) (48) (130) (19)
US dollar step up interest on US denominated borrowings
b
145 3 (1) (38) (13) 4
Foreign currency purchases, principally denominated in US dollar,
euro and Asia Pacific currencies
c
1,821 16 (26) (13) (33) 33
Total cash flow hedges 15,484 1,330 (729) (99) (176) 18
Deferred tax – – 15
Derivatives not in a designated hedge relationship 262 (211) –
Carrying value on the balance sheet 1,592 (940) (84)
Hedged items
At 31 March 2018
d
Notional
principal
£m
Asset
£m
Liability
£m
Balance in cash
flow hedge
related reserves
(gain)/loss
£m
Fair value
(gain)/loss
recognised
in OCI
£m
Amount
recycled from
cash flow hedge
related reserves
to P&L
£m
Sterling, euro and US dollar denominated borrowings
a
12,504 1,222 (608) 101 347 (333)
US dollar step up interest on US denominated borrowings
b
143 – (6) (29) 13 3
Foreign currency purchases, principally denominated in US dollar,
euro and Asia Pacific currencies
c
1,989 26 (14) (13) 8 53
Total cash flow hedges 14,636 1,248 (628) 59 368 (277)
Deferred tax – – (22)
Derivatives not in a designated hedge relationship 261 (209) –
Carrying value on the balance sheet 1,509 (837) 37

170
BT Group plc Annual Report 2019
Notes to the consolidated financial statements continued
27. Financial instruments and risk management continued
Hedged items
At 31 March 2017
d
Notional
principal
£m
Asset
£m
Liability
£m
Balance in cash
flow hedge
related reserves
(gain)/loss
£m
Fair value
(gain)/loss
recognised
in OCI
£m
Amount
recycled from
cash flow hedge
related reserves
to P&L
£m
Sterling, euro and US dollar denominated borrowings
a
10,041 1,845 (621) 87 (800) 938
US dollar step up interest on US denominated borrowings
b
146 5 (2) (45) (21) 4
Foreign currency purchases, principally denominated in US dollar,
euro and Asia Pacific currencies
c
2,327 75 (18) (74) (63) (4)
Total cash flow hedges 12,514 1,925 (641) (32) (884) 938
Deferred tax – – (95)
Derivatives not in a designated hedge relationship 321 (262) –
Carrying value on the balance sheet 2,246 (903) (127)
a
Sterling, euro and US dollar denominated borrowings are hedged using cross currency swaps and interest rate swaps. Amounts recycled to profit and loss are presented within other operating costs and
finance expense.
b
US dollar step up interest on US denominated borrowings are hedged using forward currency contracts. Amounts recycled to profit and loss are presented within finance expense.
c
Foreign currency purchases, principally denominated in US dollar, euro and Asia Pacific currencies are hedged using forward currency contracts. Amounts recycled to profit and loss in respect of these
items are presented within cost of sales and other operating costs.
d
We have presented comparatives to this information, now required by IFRS 7 following the adoption of IFRS 9, for 31 March 2018 and 31 March 2017.
All cash flow hedges were fully effective in the period.
28. Other reserves
Other comprehensive income
Capital
redemption
reserve
£m
Cash flow
reserve
a
£m
Fair
value
reserve
b
£m
Cost of
hedging
reserve
c
£m
Translation
reserve
d
£m
Total
£m
At 1 April 2016 27 173 16 – 469 685
Exchange differences
e
– – – – 227 227
Net fair value gain (loss) on cash flow hedges – 884 – – – 884
Movements in relation to cash flow hedges recognised in income
and expense – (938) – – – (938)
Fair value movement on available-for-sale assets – – (3) – – (3)
Tax recognised in other comprehensive income – 8 – – 21 29
At 31 March 2017 27 127 13 – 717 884
Exchange differences
e
– – – – (188) (188)
Net fair value gain (loss) on cash flow hedges – (368) – – – (368)
Movements in relation to cash flow hedges recognised in income
and expense – 277 – – – 277
Fair value movement on available-for-sale assets – – 11 – – 11
Tax recognised in other comprehensive income – 10 – – (9) 1
Transfer to realised profit – (83) – – – (83)
At 31 March 2018 27 (37) 24 – 520 534
Transfer to cost of hedging reserve – 81 – (81) – –
At 1 April 2018 27 44 24 (81) 520 534
Exchange differences
e
– – – – 64 64
Net fair value gain (loss) on cash flow hedges – 168 – 8 – 176
Movements in relation to cash flow hedges recognised in income
and expense – (31) – 13 – (18)
Fair value movement on assets at fair value through other
comprehensive income – – 3 – – 3
Tax recognised in other comprehensive income – (37) – – (4) (41)
Transfer to realised profit – – – – – –
At 31 March 2019 27 144 27 (60) 580 718
a
The cash flow reserve is used to record the effective portion of the cumulative net change in the fair value of cash flow hedging instruments related to hedged transactions that have not yet occurred.
Amounts ‘recognised in income and expense’ include a net charge to the cash flow reserve of £30m (2017/18: credit of £295m, 2016/17: charge of £941m) relating to fair value movements on
derivatives. The items generating these foreign exchange movements are in designated cash flow hedge relationships.
b
The fair value reserve (2017/18, 2016/17: available-for-sale reserve) is used to record the cumulative fair value gains and losses on assets classified as fair value through other comprehensive income
(2017/18, 2016/17: available-for-sale financial assets). The cumulative gains and losses are recycled to the income statement on disposal of the assets.
c
The cost of hedging reserve reflects the gain or loss on the portion excluded from the designated hedging instrument that relates to the currency basis element of our cross currency swaps. It is initially
recognised in other comprehensive income and accounted for similarly to gains or losses in the cash flow reserve.
d
The translation reserve is used to record cumulative translation differences on the net assets of foreign operations. The cumulative translation differences are recycled to the income statement on
disposal of the foreign operation.
e
Excludes £(2)m (2017/18: £1m, 2016/17: £10m) of exchange differences in relation to retained earnings attributed to non-controlling interests.

BT Group plc Annual Report 2019
171
Strategic report
Governance
Financial statements
Additional information
29. Related party transactions
Information about material related party transactions of the BT Group is set out below.
Key management personnel comprise executive and non-executive directors and members of the
Executive Committee.
Compensation
of key management personnel is disclosed in note 7.
Amounts paid to the group’s retirement benefit plans are set out in note 20.
30. Financial commitments and contingent liabilities
Financial commitments were as follows:
At 31 March
2019
£m
2018
£m
Operating lease commitments 6,619 6,597
TV programme rights commitments 2,113 2,823
Capital commitments 1,432 993
Other commitments 253 624
Total 10,417 11,037
TV programme rights commitments, mainly relating to football broadcast rights, are those for which the licence period has not yet
started.
Future minimum operating lease payments were as follows:
Payable in the year ending 31 March:
2019
£m
2018
£m
2019 – 600
2020 755 550
2021 641 513
2022 599 486
2023 555 463
2024 512 449
Thereafter 3,557 3,536
Total future minimum operating lease payments 6,619 6,597
Operating lease commitments were mainly in respect of land and buildings which arose from a sale and operating leaseback
transaction in 2001. Leases have an average term of 13 years (2017/18: 14 years) and rentals are fixed for an average of 13 years
(2017/18: 14 years).
Other than as disclosed below, there were no contingent liabilities or guarantees at 31 March 2018 other than those arising in the
ordinary course of the group’s business and on these no material losses are anticipated. We have insurance cover to certain limits for
major risks on property and major claims in connection with legal liabilities arising in the course of our operations. Otherwise, the group
generally carries its own risks.
Commitments and guarantees
BT plc
On 27 March 2019 a formal guarantee was put in place for BT Group plc to fully and unconditionally guarantee the obligations of its
wholly-owned subsidiary British Telecommunications plc (‘BT plc’) under it’s US dollar-denominated SEC-registered bonds. BT Group
will also guarantee the obligations under the existing notes and new notes issued under BT plc’s Euro Medium Term Note Programme
(EMTN), and under BT plc’s £300m 8.625% bonds due in 2020 and £600m 5.75% bonds due in 2028.
BDUK
Under the Broadband Delivery UK programme, grants received by the group may be subject to reinvestment or repayment to the local
authority depending on the level of take-up.
Telefónica UK Limited leases
We’ve provided guarantees relating to certain leases entered into by Telefónica UK Limited (formerly O2 UK Limited) prior to the
demerger of mmO2 from BT on 19 November 2001. mmO2 plc (now part of the Telefónica Group) has given BT a counter indemnity
for these guarantees. There is no exposure in the event of credit default in respect of amounts used to defease future lease obligations.
The guarantee lasts until Telefónica UK Limited has discharged all its obligations.
Legal proceedings
The group is involved in various legal proceedings, including actual or threatened litigation, and government or regulatory
investigations. However, save as disclosed below, the group does not currently believe that there are any legal proceedings, or
government or regulatory investigations that may have a material adverse impact on the operations or financial condition of the group.
In respect of each of the claims below, the nature and progression of such proceedings and investigations can make it difficult to predict
the impact they will have on the group. There are many reasons why we cannot make these assessments with certainty, including,
among others, that they are in early stages, no damages or remedies have been specified, and/or the often slow pace of litigation.

172
BT Group plc Annual Report 2019
Notes to the consolidated financial statements continued
30. Financial commitments and contingent liabilities continued
Italian business
US securities class action complaints: The plaintiffs filed a third amended complaint in December 2018. We filed a motion to dismiss
that complaint, which plaintiffs opposed. We filed our reply to the plaintiff’s opposition to the motion to dismiss on 11 January 2019.
We are awaiting a decision from the US District court.
Italian Authorities: On 11 February 2019 the Milan Public Prosecutor served BT Italia S.P.A. with a notice regarding conclusion of their
preliminary investigation. The notice (which named BT Italia, as well as various individuals) records the prosecutor’s view that as at the
conclusion of the preliminary investigation there is a basis for proceeding with its case against BT Italia for certain potential offences
under articles 5 and 25 of Legislative Decree 231/2001. BT Italia disputes this and maintains in a defence brief filed on 19 April 2019
that it should not be prosecuted. BT Italia is not presently the subject of any formal charge (nor are any of the individuals named in the
prosecutor’s notice).
Phones 4U
In December 2016, the administrators of Phones 4U started legal proceedings in the High Court in the United Kingdom against EE,
claiming payments under a retail trading agreement for sums then due in respect of revenues (net of costs) from certain customers prior
to Phones 4U entering administration. This sharing of revenue under the retail trading agreement was due to continue until September
2019, with related payments continuing until April 2021. On May 2018 we reached a confidential agreement with the administrators
of Phones 4U to settle this matter. This settlement is in line with the accruals we held to cover potential payments required by EE.
Since 2015 the administrators of Phones 4U Limited have made allegations that EE and other mobile network operators colluded to
procure Phones 4U’s insolvency. During the year proceedings were issued for an unquantified amount by the administrators and in April
2019 we submitted our defence to this claim. We continue to dispute these allegations vigorously.
Brazilian tax claims
Brazilian tax claims The Brazilian state tax authorities have made tax demands on the exchange of goods and services (ICMS) and
regulatory assessments (FUST/FUNTTEL) against certain Brazilian subsidiaries. These are indirect taxes imposed on the provision of
telecommunications services in Brazil. The state tax and regulatory authorities are seeking to impose ICMS and FUST/FUNTTEL on
revenue earned on activities that the company does not consider as being part of the provision of telecommunications services, such as
equipment rental and managed services. We have disputed the basis on which ICMS and FUST/FUNTTEL are imposed and, in the case of
ICMS, have challenged the rate which the tax authorities are seeking to apply.
We currently have 33 ICMS cases with a current potential value of £204m (as at the end of March 2019). This is the assessed amount
for all cases spanning the period from 1998 to 2012 (plus one outlier case for the period 2013 to 2016 in the state of Minas Gerais and
one case for the period 2014 to 2015 in the state of Amazonas). There are currently 56 FUST/FUNTTEL cases with a known overall
liability of £19m; with a further £4m estimated (as at the end of April 2019). The judicial process is likely to take many years. There are
eight ICMS cases worth approximately £55m which are at an advanced stage. These are currently pending before the Sao Paulo Court of
Appeal. We are waiting for the Reporting Judge to schedule the trial hearing and expect to have a date soon, following the February
judicial recess.
Regulatory matters
In respect of regulatory risks, the group provides for anticipated costs where an outflow of resources is considered probable and
a reasonable estimate can be made of the likely outcome. Estimates are used in assessing the likely value of the regulatory risk.
The ultimate liability may vary from the amounts provided and will be dependent upon the eventual outcome of any settlement.
Northern Ireland Public Sector Shared Network contract
On 4 April 2019 Ofcom opened an investigation into whether the award of the Public Sector Shared Network contract for Northern
Ireland to BT complied with relevant significant market power conditions. We are cooperating with Ofcom’s investigation.
Other regulatory matters
We hold provisions reflecting management’s estimates of regulatory risks across a range of issues, including price and service issues.
The precise outcome of each matter depends on whether it becomes an active issue, and the extent to which negotiation or regulatory
decisions will result in financial settlement.

BT Group plc Annual Report 2019
173
Strategic report
Governance
Financial statements
Additional information
Financial Statements of BT Group plc
BT Group plc company balance sheet
Registered number 04190816
At 31 March Notes
2019
£m
2018
£m
Non-current assets
Investments 2 10,952 10,885
Trade and other receivables
a
4,540 6,928
15,492 17,813
Current assets
Trade and other receivables
a
1,117 112
Cash and cash equivalents 26
1,119 118
Current liabilities
Trade and other payables
b
96 75
96 75
Total assets less current liabilities 16,515 17,856
Non-current liabilities
Loans and other borrowings
c
3,029 2,983
3,029 2,983
Equity
Ordinary shares 499 499
Share premium 1,051 1,051
Capital redemption reserve 27 27
Merger reserve 3 3,149 5,649
Own shares (167) (186)
Profit and loss account
d
8,927 7,833
Total equity 13,486 14,873
16,515 17,856
a
Trade and other receivables primarily relate to a £1,010m equity placing raised in February 2015 and net proceeds of £7,507m, before £3m of issue costs, relating to the sale of EE to British
Telecommunications plc on 29 January 2016. Subsequently £4,275m of the loan receivable relating to the sale of EE has been repaid. The balance consists of two loans to group undertakings
of £1,061m (2017/18: £1,044m) repayable on 31 January 2058 and £3,479m (2017/18: £5,884m) repayable on 21 December 2064. The loans attract interest of LIBOR plus 102.5 basis
points (2017/18: LIBOR plus 90 basis points). Included in the current trade and other receivables are loan to group undertakings of £997m (2017/18: £nil) and accrued interest of £120m
(2017/18: £112m).
b
Trade and other payables consists of loans from group undertakings of £60m (2017/18: £34m) and other creditors of £36m (2017/18: £41m).
c
Loans and other borrowings consist of a loan from group undertakings of £3,029m (2017/18: £2,983m). The loan is repayable on 31 January 2058 and attracts interest of LIBOR plus 102.5 basis
points (2017/18: LIBOR plus 90 basis points).
d
As permitted by Section 408(3) of the Companies Act 2006, no profit and loss account of the company is presented. The profit for the financial year, dealt with in the profit and loss account of the
company was £44m (2017/18: £61m).
The financial statements of the company on pages 173 to 176 were approved by the Board of Directors on 8 May 2019 and were
signed on its behalf by:
Jan du Plessis
Chairman
Philip Jansen
Chief Executive
Simon Lowth
Chief Financial Officer

174
BT Group plc Annual Report 2019
BT Group plc company statement
of changes in equity
Note
Called up share
capital
a
£m
Share
premium
account
£m
Capital
redemption
reserve
£m
Merger
reserve
£m
Own shares
b
£m
Profit
and loss
account
b,c
£m
Total
£m
At 1 April 2017 499 1,051 27 5,649 (96) 9,290 16,420
Profit for the financial year – – – – – 61 61
Dividends paid – – – – – (1,524) (1,524)
Capital contribution in respect of share-based
payments – – – – – 84 84
Net buyback of own shares
– – – – (90) (78) (168)
At 1 April 2018 499 1,051 27 5,649 (186) 7,833 14,873
Profit for the financial year – – – – – 44 44
Transfer to realised profit 3 – – – (2,500) – 2,500 –
Dividends paid – – – – – (1,503) (1,503)
Capital contribution in respect of share-based
payments – – – – – 67 67
Net buyback of own shares – – – – 19 (23) (4)
Unclaimed dividends over 10 years – – – – – 9 9
At 31 March 2019 499 1,051 27 3,149 (167) 8,927 13,486
a
The allotted, called up and fully paid ordinary share capital of the company at 31 March 2019 was £499m (31 March 2018: £499m), representing 9,968,127,681 (31 March 2018: 9,968,127,681)
ordinary shares of 5p each.
b
In 2018/19 9,066,942 shares (2017/18: 38,627,352) were issued from Own shares to satisfy obligations under employee share schemes and executive share awards at a cost of £28m (2017/18:
£130m). At 31 March 2019, 54,330,273 shares (31 March 2018: 59,249,666) with an aggregate nominal value of £3m (31 March 2018: £1m) were held as part of Own shares at cost.
c
As permitted by Section 408(3) of the Companies Act 2006, no profit and loss account of the company is presented. The profit for the financial year, dealt with in the profit and loss account of the
company, was £44m (2017/18: £61m).

BT Group plc Annual Report 2019
175
Strategic report
Governance
Financial statements
Additional information
Notes to the company financial statements
1. BT Group plc accounting policies
Principal activity
The principal activity of the company is to act as ultimate holding
company of the BT group.
Accounting basis
As used in these financial statements and associated notes, the
term ‘company’ refers to BT Group plc (a public company limited
by shares). These separate financial statements of the company
are prepared in accordance with, and presented as required by,
the Companies Act 2006 as applicable to companies using
Financial Reporting Standard 101 (FRS 101). These financial
statements have been prepared in accordance with FRS 101.
FRS 101 incorporates, with limited amendments, International
Financial Reporting Standards (IFRS).
Financial statements
The financial statements are prepared on a going concern basis
and under the historical cost convention.
As permitted by Section 408(3) of the Companies Act 2006, the
company’s profit and loss account has not been presented.
New and amended accounting standards effective
during the year
There have been no new or amended accounting standards or
interpretations adopted during the year that have a significant
impact on the financial statements.
Exemptions
As permitted by FRS 101, the company has taken advantage of
the disclosure exemptions available under that standard in
relation to business combinations, share-based payments,
non-current assets held for sale, financial instruments, capital
management, and presentation of comparative information in
respect of certain assets, presentation of a cash flow statement,
standards not yet effective, impairment of assets and related
party transactions. The company intends to continue to take
advantage of these exemptions in future years. Further detail is
provided below.
Where required, equivalent disclosures have been given in the
consolidated financial statements of BT Group plc.
The BT Group plc consolidated financial statements for the year
ended 31 March 2019 contain a consolidated cash flow
statement. Consequently, as permitted by IAS 7 ‘Statement of
Cash flow’, the company has not presented its own cash flow
statement.
The BT Group plc consolidated financial statements for the year
ended 31 March 2019 contain related party disclosures.
Consequently, the company has taken advantage of the
exemption in IAS 24, ‘Related Party Disclosures’ not to disclose
transactions with other members of the BT Group.
The BT Group plc consolidated financial statements for the year
ended 31 March 2019 contain financial instrument disclosures
which comply with IFRS 7, ‘Financial Instruments: Disclosures’.
Consequently, the company is exempt from the disclosure
requirements of IFRS 7 in respect of its financial instruments.
Investments
Investments are stated at cost and reviewed for impairment if
there are indicators that the carrying value may not be
recoverable. An impairment loss is recognised to the extent that
the carrying amount cannot be recovered either by selling the
asset or by continuing to hold the asset and benefiting from the
net present value of the future cash flows of the investment.
Taxation
Full provision is made for deferred taxation on all temporary
differences which have arisen but not reversed at the balance
sheet date. Deferred tax assets are recognised to the extent that
it is regarded as more likely than not that there will be sufficient
taxable profits from which the underlying timing differences can
be deducted. The deferred tax balances are not discounted.
Dividends
Dividend distributions are recognised as a liability in the year in
which the dividends are approved by the company’s shareholders.
Interim dividends are recognised when they are paid; final
dividends when authorised in general meetings by shareholders.
Dividend income is recognised on receipt.
Share capital
Ordinary shares are classified as equity. Repurchased shares of the
company are recorded in the balance sheet as part of Own shares
and presented as a deduction from shareholders’ equity at cost.
Cash and cash equivalents
Cash and cash equivalents comprise cash in hand and current
balances with banks and similar institutions, which are readily
convertible to cash and are subject to insignificant risk of changes
in value and have an original maturity of three months or less.
Share-based payments
The company does not incur a charge for share-based payments.
However, the issuance by the company of share options and
awards to employees of its subsidiaries represents additional
capital contributions to its subsidiaries. An addition to the
company’s investment in subsidiaries is recorded with a
corresponding increase in equity shareholders’ funds. The
additional capital contribution is determined based on the fair
value of options and awards at the date of grant and is recognised
over the vesting period.
2. Investments
Cost
Total
£m
At 31 April 2017 10,801
Additions 84
At 31 March 2018 10,885
Additions 67
At 31 March 2019 10,952
Additions of £67m (2017/18: £84m) comprise capital
contributions in respect of share-based payments.

176
BT Group plc Annual Report 2019
Notes to the company financial statements continued
2. Investments continued
The company held a 100% investment in BT Group Investments
Limited, a company registered in England and Wales, throughout
2018/19 and 2017/18.
3. Merger reserve
On 29 January 2016, the company issued 1,594,900,429
ordinary shares of 5p at 470.70p per share resulting in a total of
£80m being credited to the share capital.
These shares were used as part consideration for the acquisition
of EE, which completed on 29 January 2016. As a result of this
transaction, a merger reserve was created of £7,424m net of
£3m issue costs. The acquisition of EE was structured by way of a
share-for-share exchange. This transaction fell within the
provisions of Section 612 of the Companies Act 2006 (merger
relief) such that no share premium was recorded in respect of the
shares issued. The company chose to record its investment in EE
at fair value and therefore recorded a merger reserve equal to the
value of the share premium which would have been recorded had
Section 612 of the Companies Act 2006 not been applicable ie
equal to the difference between the fair value of EE and the
aggregate nominal value of the shares issued.
This merger reserve was initially considered unrealised on the
basis it was represented by the investment in EE. This was not
considered to represent qualifying consideration (in accordance
with Tech 02/10 (Guidance on the determination of realised
profits and losses in the context of distributions under the
Companies Act 2006)), as superseded by Tech 02/17 (Guidance
on realised and distributable profits under the Companies
Act 2006).
Immediately following the acquisition of EE, the company’s
investment in EE was transferred to BT in exchange for an
intercompany loan. To the extent the loan is settled in qualifying
consideration, the related proportion of the merger reserve is
considered realised. Hence the merger reserve is an unrealised
reserve until it is realised by the settlement of the intercompany
loan by qualifying consideration.
During 2018/19, £2,500m (2017/18: £nil) of merger reserve
was transferred to realised profit following the settlement of an
intercompany loan by qualifying consideration.
4. Other information
Dividends
The Board recommends that a final dividend in respect of the year
ended 31 March 2019 of 10.78p per share will be paid to
shareholders on 9 September 2019, taking the full year proposed
dividend in respect of 2018/19 to 15.4p (2017/18: 15.4p,
2016/17: 15.4p) which amounts to approximately £1,527m
(2017/18: £1,524m, 2016/17: £1,532m). This final dividend is
subject to approval by shareholders at the Annual General
Meeting and therefore the liability of approximately £1,069m
(2017/18: £1,044m, 2016/17: £1,050m) has not been
included in these financial statements. The proposed dividend will
be payable to all shareholders on the Register of Members on
9 August 2019.
Employees
The chairman, the executive directors and the company
secretary & general counsel, governance of BT Group plc were the
only employees of the company during 2018/19 and 2017/18.
The costs relating to qualifying services provided to the
company’s principal subsidiary, British Telecommunications plc,
are recharged to that company.

177
BT Group plc Annual Report 2019 Strategic report
Governance
Financial statements
Additional information
Subsidiaries
Company name
Group
interest in
allotted
capital
a
Share class
Held directly
United Kingdom
81 Newgate Street, London, EC1A 7AJ, United
Kingdom
BT Group Investments
Limited 100% ordinary
BT Group Nominees
Limited 100% ordinary
Held via other group companies
Albania
Rr. Murat Toptani, Eurocol Center, Kati 8,
Tirana, Albania
BT Albania Limited SH.P.K 100% ordinary
Algeria
20 Micro zone d’Activités Dar El Madina,
Bloc B, Loc N01 Hydra, Alger, 16000, Algeria
BT Algeria
Communications SARL 100% ordinary
Argentina
Lola Mora 421, 15th Floor, Puerto Madero,
Buenos Aires, C1107DDA, Argentina
BT Argentina S.R.L. 100% ordinary
BT Latam Argentina S.A 100% common
Australia
Level 1, 76 Berry Street, North Sydney NSW
2060, Australia
BT Australasia Pty Limited 100% ordinary
100% preference
Austria
Louis-Häiger-Gasse 10, 1210, Wien, Austria
BT Austria GmbH 100% ordinary
Azerbaijan
The Landmark III Building, 8th Floor, c/o
Deloitte & Touche, 96 Nizami Street, Baku, AZ
1010, Azerbaijan
BT Azerbaijan Limited,
Limited Liability Company 100% ordinary
Bahrain
Suite #650, 6th oor, Building No. 247,
Road 1704, Diplomatic Area 317, Bahrain
BT Solutions Limited
(Bahrain Branch)
b
100% –
Bangladesh
House 51 (3rd Floor), Road 9, Block F, Banani,
Dhaka, 1213, Bangladesh
BT Communications
Bangladesh Limited 100% ordinary
Company name
Group
interest in
allotted
capital
a
Share class
Barbados
The Gabbles, Haggatt Hall, St Michael,
BB11063, Barbados
BT (Barbados) Limited 100% ordinary
Belarus
58 Voronyanskogo St, Oce 89, Minsk
220007, Belarus
BT BELRUS Foreign
Limited Liability Company 100% ordinary
Belgium
Telecomlaan 9, 1831 Diegem, Belgium
BT Global Services Belgium
BVBA 100% ordinary
BT Limited
b
100% –
BT Professional Services
(Holdings) N.V. 100% ordinary
Rue de L’Aêropostale 8, 4460
Grâce-Hollogne, Belgium
IP Trade SA 100% ordinary
Bermuda
Century House, 16 Par-la-Ville Road, Hamilton,
HM08, Bermuda
Communications Global
Network Services Limited 100% ordinary
Bolivia
Avenida Arce esquina Rosendo Gutierrez,
Edico Multicentre Torre B, Piso 12, La Paz,
Bolivia
BT Solutions Limited
Sucursal Bolivia
b
100% –
Bosnia and Herzegovina
ul. Despiceva broj 3/II, Sarajevo, Sarajevo-Stari
Grad, 71000, Bosnia and Herzegovina
BTIH Teleconsult
Drustvo sa organicenom
odgovornoscu za
posredovanje i zastupanje
d.o.o. Sarajevo 100% –
Botswana
Plot 113, Unit 28 Kgale Mews, Gaborone
International Finance Park, Gaborone,
PO BOX 1839, Botswana
BT Global Services
Botswana (Proprietary)
Limited 100% ordinary
Brazil
Avenida Das Naçôes Unidas, 4777- 17 andar-
Parte- Jardim Universidade, São Paulo- SP-
CEP, 05477- 000, Brazil
BT Global Communications
do Brasil Limitada 100% quotas
Company name
Group
interest in
allotted
capital
a
Share class
Avenida Das Nações Unidas, 4777 - 14,
andar- parte- Jardim Universidade -
São Paulo- SP- CEP, 05477-000, Brazil
BT LatAm Holdings Brasil
Ltda 100% common
BT Communications do
Brasil Limitada 100% quotas
Rodovia SP 101, KM 9,5, Trecho Campinas-
Monte Mor, Unidade 27, Bloco Beta, Distrito
Industrial, Hortolandia - SP- CEP, São Paolo,
13185-900, Brazil
BT Brasil Serviços de
Telecomunicações Ltda 100% quotas
BT LatAm Brasil Ltda. 100% quotas
British Virgin Islands
Sea Meadow House, P.O. Box 116, Road Town,
Tortola, British Virgin Islands
BT LatAm (BVI)
Corporation 100% common
Bulgaria
51B Bulgaria Blvd., . 4, Soa, 1404, Bulgaria
BT Bulgaria EOOD 100% ordinary
Canada
200 King St W, Suite 1904, Toronto ON M5H
3T4, Canada
BT Canada Inc. 100% common
Tikit, Inc. 100% ordinary
Cabo Verde
Avenida Andrade Corvo, 30, Praia, CP63,
Cabo Verde
B. Telecomunicações,
Cabo Verde, Sociedade
Unipessoal, SA 100% ordinary
Chile
55 Ocina 52, Las Condes, Santiago, 7580067,
Chile, Chile
Servicios de
Telecomunicaciones BT
Global Networks Chile
Limitada 100% ordinary
China
Building 16, 6th Floor, Room 602-B, No. 269
Wuyi Road, Hi-tech Park, Dalian, 116023,
China
BT Technology (Dalian)
Company Limited 100% registered
No. 3 Dong San Huan Bei Lu, Chao Yang District,
Beijing, 100027, China
BT Limited, Beijing Oce
b
100% –
Related undertakings

178
BT Group plc Annual Report 2019
Related undertakings continued
Company name
Group
interest in
allotted
capital
a
Share class
No. 31 Software Park Road, Tower A, Science
& Technology Building, Dalian Software Park,
Dalian, 116023, China
BT Global Services (Dalian)
Co. Ltd. 100% registered
Room 1206, Tower A, United Plaza, 5022 Bin
He Avenue, Fu Tian District, Shenzhen, P. R.
China
Infonet Primalliance
Shenzhen Co. Ltd. 35% ordinary
Room 2101-2103, 21/F, International Capital
Plaza, No. 1318 North Sichuan Road, Hong Kou
District, Shanghai, 200080, China
BT China Limited-
Shanghai Branch Oce
b
100% –
Room 4B, 7/F, Tower W3, Oriental Plaza, 1 East
Chang An Avenue, Dong Cheng District, Beijing,
P. R. China
Infonet Primalliance
Beijing Co. Ltd. 66% ordinary
Room 601, No. 2 BLDG, 750 West Zhong Shan
Rd., Shanghai, 200051, P.R .China
Infonet Primalliance
Shanghai Co. Ltd. 28% ordinary
Room 635-3, No. 2 BLDG, 351 Guo Shou Jing
Road, Zhang Jiang High Technology Park,
Shanghai, P. R. China
Infonet Primalliance
Holding Co. Ltd. 100% ordinary
Room 702A, Tower W3,Oriental Plaza,
1 East Chang An Avenue, Dongcheng, Beijing,
100738, China
BT China Limited 100% registered
Unit 1537B, Floor 15th, No. 55, Xili Road,
Shanghai Free Trade Zone, Shanghai, China
BT China Communications
Limited 50% ordinary
Colombia
Calle 113 # 7-21, Torre A ocina 1112,
Teleport Business Park, Bogota, Colombia
América Inalámbrica S.A. 100% common
BT Colombia Limitada 100% quotas
BT LatAm Colombia S.A. 100% common
BT LatAm Holdings
(Colombia) S.A. 100% common
Costa Rica
Centro Corporativo Internacional, Piso 1,
Avenida 6 y 8, Calle 26 y 28, Barrio Don Bosco,
Costa Rica
BT Global Costa Rica SRL 100% ordinary
BT LatAm Costa Rica, S.A. 100% common
Company name
Group
interest in
allotted
capital
a
Share class
Côte d’Ivoire
Abidjan Plateau, Rue du commerce, Immeuble
Nabil 1er étage, 01 BP 12721 Abidjan 01,
Côte d’Ivoire
BT Côte d’Ivoire 100% ordinary
Croatia
Savska 64, 10 000 Zagreb, Croatia
BT Solutions Limited
Podruznica Hrvatska
b
100% –
Cyprus
236 Strovolos Avenue, Strovolos 2048,
Nicosia, Cyprus
BT Solutions Limited
b
100% –
Czech Republic
Katerinska 466/40, Nove Mesto, Prague 2,
120 00, Czech Republic
BT Limited, organizacni
slozka
b
100% –
Denmark
Havnegade 39, 1058, Kobenhavn K, Denmark
BT Denmark ApS 100% ordinary
Dominican Republic
Av. Abraham Lincoln Esq. Jose Amado Soler,
Edif. Progresso, Local 3-A, Sector Ens.
Serralles, Santo Domingo, Dominican Republic
BT Dominican Republic,
S. A. 100% ordinary
BT LatAm Dominicana,
S.A. 100% common
Ecuador
Av. Amazonas N21-252 y Carrión, Edicio
Londres, 4° Piso, Quito, Ecuador
BT Solutions Limited
(Sucursal Ecuador)
b
100% –
El Salvador
Boulevard Orden de Malta, Centro Profesional
Madre Tierra, Local 10, Primer Nivel, Antiguo
Cuscatlán, La Libertad, El Salvador
BT El Salvador, Limitada de
Capital Variable 100% ordinary
Edicio Centro Profesional Madre Tierra,
Local 10, Piso 1, Santa Elena, Antiguo
Cuscatlan, El Salvador
BT LatAm El Salvador, S.A.
de CV 100% common
Egypt
1 Wadi El Nile St., Mohandessin, Giza, Cairo,
Egypt
BT Telecom Egypt LLC 100% stakes
Company name
Group
interest in
allotted
capital
a
Share class
Estonia
A.H. Tammsaare tee 47, Tallinn, 11316, Estonia
BT Solutions Limited Eesti
Filiaal
b
100% –
Finland
Mannerheimvägen 12 B 6, 00100 Helsinki,
Finland
BT Nordics Finland Oy 100% ordinary
France
Tour Ariane, 5 place de la Pyramide, La Defense
Cedex, 92088 PARIS, France
BT France S.A.S. 100% ordinary
BT Newco France S.A.S. 100% ordinary
BT Services S.A.S 100% ordinary
Georgia
74 Ilia Chavchavadze Avenue, Tbilisi, Georgia
BT Georgia Limited LLC 100% –
Germany
Barthstraße 4, 80339, Munich, Germany
BT (Germany) GmbH &
Co. oHG 100% ordinary
BT Deutschland GmbH 100% ordinary
BT Garrick GmbH 100% ordinary
Franfurterstrasse 21-25, 65760, Eschborn
Taunus, Germany
IP Trade Networks GmbH 100% ordinary
Ghana
No 11 Adaman Loop, Near Abeka Junction, P.O.
Box AN 19113, Tesano, Accra - North, Ghana
BT Ghana Limited 100% ordinary
Gibraltar
Montagu Pavilion, 8-10 Queensway, Gibraltar
BT (Gibraltar) Limited 100% ordinary
Greece
75 Patision Street, Athens, 10434, Greece
BT Solutions Limited-
Greek Branch
b
100% –
Guatemala
3a Avenida 13–78, Zona 10 Torre Citibank,
Nivel 2, Ocina No. 206, Guatemala
BT Guatemala S.A. 100% unique
Comsat de Guatemala S.A. 100% common
BT LatAm Guatemala, S.A. 100% common

179
BT Group plc Annual Report 2019 Strategic report
Governance
Financial statements
Additional information
Company name
Group
interest in
allotted
capital
a
Share class
Honduras
Colonia Lomas Del Guijarro sur, edicio Plaza
azul, 2do. Nivel, local #26, Tegucigalpa,
Honduras
BT Sociedad De
Responsabilidad Limitada 100% –
Edicio Plaza Azul, Piso 2 do Nivel, Local No.
26, Colonia Lomas del Guijarro Sur, Avenida
Paris, Calle Viena, Tegucigalpa, Honduras
BT LatAm Honduras, S.A. 100% common
Hong Kong
38th Floor Dorset House, Taikoo Place, 979
King’s Road, Island East, Hong Kong
BT Hong Kong Limited 39% ordinary
61% preference
Infonet Primalliance Co.,
Limited 100% ordinary
Infonet China Limited 100% ordinary
Room 1102, Lee Garden One, 33 Hysan
Avenue, Causeway Bay, Hong Kong
IP Trade Networks Limited 100% ordinary
Hungary
Budafoki út 91-13, 1117 Budapest, Hungary
BT Limited Magyarorszagi
Fioktelepe
b
100% –
BT ROC Kft 100% business
Iceland
BDO ehf, Skutuvogi 1E, 104 Reykjavik, Iceland
BT Solutions Limited Útibú
á Íslandi
b
100% –
India
602, Tower B, RMZ Innity, Municipal No. 3,
Old Madras Road, Benninganahalli, Bengaluru,
Karnataka, 560016, India
BT Professional Services
(India) Private Limited 100% ordinary
11th Floor, Eros Corporate Tower, Opp.
International Trade Tower, Nehru Place, New
Delhi, 110019, India
BT (India) Private Limited 100% ordinary
BT e-Serv (India) Private
Limited 100% equity
BT Global Business
Services Private Limited 100% ordinary
BT Global Communications
India Private Limited 74% ordinary
BT Telecom India Private
Limited 74% ordinary
A-47, Hauz Khas, New Delhi, Delhi-DL,
110016, India
Orange Services India
Private Limited 100% ordinary
Company name
Group
interest in
allotted
capital
a
Share class
Indonesia
World Trade Centre 5, Lantai. 13, Jl. Jend.
Sudirman Kav. 29-31, Kel. Karet Setiabudi,
Jakarta Selatan, Jakarta, 12920, Indonesia
PT BT Indonesia 100% ordinary
PT BT Communications
Indonesia 95% ordinary
PT Sun Microsystems
Indonesia 60% ordinary
Israel
Beit Oz, 14 Abba Hillel Silver Rd, Ramat Gan,
52506, Israel
B.T. Communication Israel
Ltd 100% ordinary
Italy
Strada Santa Margherita, 6 / A, 43123, Parma,
Italy
BT Enìa Telecomunicazioni
S.P.A. 87% ordinary
Via Charles Robert Darwin, no 85, 20019,
Settimo Milanese, Italy
ERPTech S.p.A. 99% ordinary
Via Correggio 5, 20097, San Donato Milanese,
Milan, Italy
Radianz Italia S.r.l. 100% ordinary
Via Mario Bianchini 15, 00142 Roma, Italy
BT Global Services Limited
b
100% –
Via Pianezza n° 123, Torino, Italy
Atlanet SpA 99% ordinary
Via Tucidide 56, Torre 7, 20134, Milano, Italy
Basictel SpA 99% ordinary
BT Italia S.p.A. 99% ordinary
BT Nederland N.V.
b
100% –
Infonet Italia S.p.A 100% ordinary
Nuova Societa di
Telecomunicazioni SpA 99% ordinary
Jamaica
26 Beechwood Avenue, Cross Roads, St.
Andrew, Kingston 5, Jamaica
BT Jamaica Limited 100% ordinary
Japan
ARK Mori Building, 12-32 Akasaka, 1-Chome,
Minato-Ku, Tokyo, 107 - 6024, Japan
BT Global Japan Corporation 100% ordinary
BT Japan Corporation 100% ordinary
Company name
Group
interest in
allotted
capital
a
Share class
Jersey
26 New Street, St Helier, JE2 3RA, Jersey
Ilford Trustees (Jersey)
Limited 100% ordinary
First Floor Windward House, La Route de la
Liberation, St Helier, JE1 1BG, Jersey
BT US Investments Limited 100% ordinary
PO Box 264, Forum 4, Grenville Street, St
Helier, JE4 8TQ, Jersey
BT Jersey Limited 100% ordinary
Jordan
Al Gardens Area (Tiaa Al Ali), Al Salheen
Neighborhood, Building #185, 7th Floor, Was
Al Tal Street, Amman, 11118, Jordan
BT (International)
Holdings Limited (Jordan) 100% ordinary
Kazakhstan
36 Al Farabi Ave., Bldg. B, Almaty Financial
District, Almaty, Republic of Kazakhstan,
050059, Kazakhstan
BT Kazakhstan LLP 100% –
Kenya
6th Floor, Virtual Oces, Morningside Oce
Park, Ngong Road, Nairobi, Kenya
BT Communications Kenya
Limited 100% ordinary
P.O. BOX 10032-00100, Nairobi, Kenya
BT Telecommunications
Kenya Limited 100% ordinary
Korea
8th Floor, KTB Building, 66 Yeoui-daero,
Yeongdeungpo-gu, Seoul, 07325, Korea
BT Global Services Korea
Limited 100% common
Kuwait
Block 2-A, 9th Floor, Ahmad Al Jaber Street,
Sharq, Kuwait
BT Solutions Limited –
Kuwait Branch
b
100% –
Latvia
Muitas iela 1A, Riga, LV-1010, Latvia
BT Latvia Limited,
Sabiedriba ar ierobezotu
atbildibu 100% ordinary
Lebanon
Abou Hamad, Merheb, Nohra & Chedid Law
Firm, Chbaro Street, 22nd Achraeh Warde
Building, 1st Floor, Beirut, P.O.BOX 165126,
Lebanon
BT Lebanon S.A.L. 100% ordinary

180
BT Group plc Annual Report 2019
Related undertakings continued
Company name
Group
interest in
allotted
capital
a
Share class
Lithuania
Aludariu str 2-33, LT-01113 Vilnius, Lithuania
UAB BTH Vilnius 100% ordinary
Luxembourg
12 rue Eugene Ruppert, L 2453, Luxembourg
BT Global Services
Luxembourg SARL 100% ordinary
BT Professional Services
(Luxembourg) S.A. 100% ordinary
BT Broadband
Luxembourg Sàrl 100% ordinary
BT Luxembourg
Investment Holdings Sarl 100% ordinary
Macedonia
Str. Dame Gruev no.8, 5th oor, Building “Dom
na voenite invalidi”, SKOPJE 1000, Macedonia
BT Solutions Limited
Branch Oce in Skopje
b
100% –
Macao
Avenida da.Praia Grande, No. 367-371, Keng
Ou Building, 15th andar C, em Macao, Macau,
Macao
BT Hong Kong Ltd. –
Macau Branch
b
100% –
Malawi
BDO Tax & Advisory Services (Pvt) Ltd, 6th
Floor Unit House, 12 Victoria Street PO BOX
3038, Blantyre, Malawi
BT Malawi Limited 100% ordinary
Malaysia
Menara BT, Level 8, Tower 3, Avenue 7,
Bangsar South, No.8, Jalan Kerinchi, 59200,
Kuala Lumpur, Malaysia
BT Global Services (M)
Sdn Bhd 100% ordinary
BT Global Services
Solutions Sdn Bhd 100% ordinary
BT Global Technology (M)
Sdn. Bhd. 100% ordinary
BT Systems (Malaysia)
Sdn Bhd 100% ordinary
Malta
Tower Gate Place, Tal-Qroqq Street, Msida MSD
1703, Malta
BT Solutions Limited
b
100% –
Mauritius
10 Frere Felix De Valois Street, Port Louis,
Mauritius
BT Global Communications
(Mauritius) Limited 100% ordinary
Company name
Group
interest in
allotted
capital
a
Share class
Mexico
Av. Renato Leduc 321, Col. Toriello Guerra,
14050 Mexico D.F.
BT LatAm México, S.A. de C.V. 100% common
Opimus S.A. de C.V. 100% common
Moldova
IPTEH Building, 65 Stefan cel Mare Blvd,
Oce 806, Chisinau, Republic of Moldova
BT MDV Limited 100% ordinary
Montenegro
Bulevar revolucije 7, Podgorica, 81000,
Montenegro
BT Montenegro DOO 100% –
Morocco
193, Avenue HASSAN II, Casablanca, MAROC
s/c Domicilia services, Morocco
BT Solutions Limited –
Morocco Branch
b
100% –
Espace Jet Business Class, 16/18 Lot Attouk
Sidi Maarouf, Casablanca, 20190, Morocco
Syntone S.A.R.L. 100% ordinary
Mozambique
Av. 25 de Setembro, 1230, 3º, Bloco 5, Caixa
Postal 4200, Maputo, 4200, Mozambique
BT Mozambique, Limitada 100% quotas
Namibia
PO Box 2184, 61 Bismarck Street, Windhoek,
Namibia
BT Solutions Limited
b
100% –
Netherlands
Minerva & Mercurius building, Herikerbergweg
2, 1101CM, Amsterdam Zuidoost, Netherlands
BT (Netherlands) Holdings
B.V. 100% ordinary
BT Nederland N.V. 100% ordinary
BT Professional Services
Nederland B.V. 100% ordinary
New Zealand
c/o BDO Auckland, Level 4, 4 Graham Street,
Auckland, 1010, New Zealand
BT Australasia Pty Limited
– New Zealand Branch
b
100% –
Nicaragua
Edicio Invercasa, 5to Piso, Suite 505, Via
Fontana, frente al colegio La Salle, Managua,
Nicaragua
BT LatAm Nicaragua, S.A. 100% common
BT Nicaragua S.A. 100% capital
Company name
Group
interest in
allotted
capital
a
Share class
Niger
57, Rue des Sorkhos, BP 616, Niamey, Niger
BT Niger 100% ordinary
Nigeria
ADOL House, 15 CIPM Avenue, Central
Business District, Alausa, Ikeja, Lagos, Nigeria
BT (Nigeria) Limited 100% ordinary
Norway
Munkedamsveien 45, c/o BDO AS, 0121 Oslo,
Norway
BT Solutions Norway AS 100% ordinary
Oman
Maktabi Building, Building No. 458,
Unit No. 413 (4th Floor, Road No - R41,
Block No. 203, Plot No. 107, Zone No. SW41,
Complex No. 271, Al Watiyah, Bausher,
Muscat, Sultanate of Oman, Oman
BT International Holdings
Limited & Co. LLC 100% ordinary
Pakistan
2nd Floor, Block C, Lakson Square, Building
No. 1, Sarwar Shaheed Road, Karachi, 74200,
Pakistan
BT Pakistan (Private)
Limited 100% ordinary
Panama
Edicio Credicorp Bank, Piso 3, Ocina 301,
Cuidad de Panama, Panama
BT de Panama, S.R.L. 100% ordinary
BT LatAm Panama, Inc. 100% common
Paraguay
Gral Diaz 521, Edicio Internacional Faro,
Piso 6, Asuncion, Paraguay
BT Paraguay S.R.L. 100% quotas
Peru
Calle Martir Olaya, 129 of 1901, Miraores,
Lima, Peru
BT LatAm Peru S.A.C. 100% common
BT Peru S.R.L. 100% ordinary
Philippines
11th Floor, Page One Building, 1215 Acacia
Avenue, Madrigal, Business park, Ayala
Alabany, Muntinlupa city, 1780 City, Manila,
1780, Philippines
IT Holdings, Inc 100% ordinary
Sun Microsystems
Philippines, Inc 51% common
18th Floor, Philamlife Tower, 8767 Paseo de
Roxas, Makati City, 1226, Philippines
BT Communications
Philippines Incorporated 100% ordinary

181
BT Group plc Annual Report 2019 Strategic report
Governance
Financial statements
Additional information
Company name
Group
interest in
allotted
capital
a
Share class
c/o Sun Microsystems Phil Inc., 8767 Paseo de
Roxas, Makati City, Philippines
PSPI-Subic, Inc 51% ordinary
Poland
Al. Armii Ludowej 14, 00-638 Warszawa,
International Business Center, Poland
BT Poland Spółka
Z Ograniczoną
Odpowiedzialnością 100% ordinary
Portugal
Rua D. Francisco Manuel de Melo 21-1,
1070-085 Lisboa, Portugal
BT Portugal –
Telecomunicaçöes,
Unipessoal Lda 100% ordinary
Puerto Rico
The Prentice-Hall Corporation System, Puerto
Rico, Inc., c/o Fast Solutions, LLC, Citi Tower,
252 Ponce de Leon Avenue, Floor 20, San Juan,
Puerto Rico, 00918, Puerto Rico
BT Communications Sales,
LLC Puerto Rico branch
b
100% –
Qatar
1413, 14th Floor, Al Fardan Oce Tower, Doha,
31316, Qatar
BT Global Services (North
Gulf) LLC 49% ordinary
Republic of Ireland
2 Grand Canal Plaza, Upper Grand Canal Street,
Dublin 4, Republic of Ireland
BT Communications
Ireland Group Limited 100% ordinary
BT Communications
Ireland Holdings Limited 100% ordinary
BT Communications
Ireland Limited 100% ordinary
BT Global Communications
(Ireland) Limited 100% ordinary
Canal Capital Investment
Limited 100% ordinary
Whitestream Industries
Limited 100% ordinary
Romania
35-37 Oltenitei Str., Cladirea A1, Biroul Nr. 52,
Bucharest, Sector 4, Romania
BT Global Services
Limited Londra Sucursala
Bucuresti
b
100% –
Company name
Group
interest in
allotted
capital
a
Share class
Russia
Room 62, prem xx, Floor 2, Pravdy, 26,
127137, Moscow, Russian Federation
BT Solutions Limited
Liability Company 100% –
Serbia
Dimitrija Georgijevica Starike 20, Belgrade,
11070, Serbia
BT Belgrade d.o.o 100% ordinary
Sierra Leone
84 Dundas Street, Freetown, Sierra Leone
BT (SL) Limited 100% ordinary
Singapore
Level 3, #03-01/02 & #03-04, Block B,
Alexandra Technopark, 438B Alexandra Road,
119968, Singapore
BT (India) Private Limited
Singapore Branch
b
100% –
BT Global Services
Technologies Pte. Ltd. 100% ordinary
BT Global Solutions Pte.
Ltd. 100% ordinary
BT Singapore Pte. Ltd. 100% ordinary
Sun Vietnam Pte. Ltd. 60% ordinary
Slovakia
Dvorakovo nabrezie 4, 811 02, Bratislava,
Slovakia
BT Slovakia s.r.o. 100% ordinary
Slovenia
CESTA V MESTNI LOG 1, 1000 LJUBLJANA,
Slovenia
BT GLOBALNE STORITVE,
telekomunikacijske
storitve, obdelava
podatkov, podatkovnih
baz; d.o.o. 100% ordinary
South Africa
24-18th Street, Menlo Park, Pretoria, 0081,
South Africa
EE Communications (South
Africa) Proprietary Limited 100% ordinary
BT Building North Oce Park, 54 Maxwell
Drive, Woodmead, 2191, South Africa
BT Communications
Services South Africa (Pty)
Limited 70% ordinary
First Floor, Culross Court North, 16 Culross
Road, Bryanston 2021, South Africa
BT Limited
b
100% –
Company name
Group
interest in
allotted
capital
a
Share class
Spain
C/ Isabel Colbrand 6-8, 28050, Madrid, Spain
BT ESPAÑA, Compañia
de Servicios Globales de
Telecommunicaciones,S.A 100% ordinary
Sri Lanka
Charter House 65/2, Sir Chittampalam A.,
Gardiner Mawatha, Colombo, 2, Sri Lanka
BT Communications Lanka
(Private) Limited 100% ordinary
Sudan
Alskheikh Mustafa Building, Parlman Street,
Khartoum, Sudan
Newgate Communication
(Sudan) Co. Ltd 100% ordinary
Sweden
Box 30005, 104 25, Stockholm, Sweden
BT Nordics Sweden AB 100% ordinary
Switzerland
Richtistrasse 5, 8304 Wallisellen, Switzerland
BT Switzerland AG 100% ordinary
Taiwan
Shin Kong Manhattan Building, 14F, No. 8,
Sec.5, Xinyi Road, Taipei, 11049, Taiwan
BT Limited Taiwan Branch
b
100% –
Tanzania
BDO East Africa, 1st Floor-Wing B, Infotech
Place, Mwai Kibaki Road, Dar es Salaam, Tanzania
BT Solutions Limited –
Tanzania Branch
b
100% –
Thailand
Athenee Tower, 23rd Floor, (CEO Suite, Suite 38
& 40), 63 Wireless Road, Lumpini, Pathumwan,
Bangkok, 10330, Thailand
BT Siam Communications
Co. Ltd. 49% class B
BT Siam Limited 69% preference
Trinidad and Tobago
2nd Floor CIC Building, 122-124 Frederick
Street, Port of Spain, Trinidad and Tobago
BT Solutions Limited
b
100% –
Tunisia
BT chez BDO Tunisie, Immeuble, ENNOUR
BUILDING 3ème étage, Centre Urbain Nord
1082, Mahrajène Tunis, Tunisia
BT Tunisia S.A.R.L 100% ordinary

182
BT Group plc Annual Report 2019
Related undertakings continued
Company name
Group
interest in
allotted
capital
a
Share class
Turkey
Yenisahra Mah. Yavuz Selim Cad. No.19/A D.4
Ataşehir, İstanbu, 34700, Turkey
BT Bilisim Hizmetleri
Anonim Şirketi 100% ordinary
BT Telekom Hizmetleri
Anonim Şirketi 100% common
Uganda
6th Floor Block C, Nakawa Business Park, Plot
3 - 5, New Portbell Road, Kampala, Uganda
BT Solutions Limited
b
100% –
Ukraine
Oce 702, 34 Lesi Ukrainky Boulevard, Kyiv
01042, Ukraine
BT Ukraine Limited
Liability Company 100% stakes
United Arab Emirates
Oce No G03, Ground Floor, EIB Building No
04, Dubai, United Arab Emirates
BT MEA FZ-LLC 100% ordinary
Oce No. (F6) International Business Center,
Building No. (27W10), Three Sails Tower,
Cornish, Abu Dhabi, United Arab Emirates
BT UAE Limited - Abu
Dhabi Branch
b
100% –
Oce no.206 BLOCK B, Diamond Business
Center 1, Al Barsha South Third, Dubai,
P.O.BOX 25205, United Arab Emirates
BT UAE Limited - Dubai
Branch (1)
b
100% –
BT UAE Limited - Dubai
Branch (2)
b
100% –
United Kingdom
81 Newgate Street, London, EC1A 7AJ, United
Kingdom
Autumnwindow Limited
100% ordinary
Autumnwindow No.2
Limited 100% ordinary
Autumnwindow No.3
Limited 100% ordinary
BPSLP Limited 100% ordinary
British
Telecommunications plc 100% ordinary
Bruning Limited 100% ordinary
BT (International) Holdings
Limited 100% ordinary
BT (RRS LP) Limited 100% ordinary
BT Centre Nominee 2
Limited 100% ordinary
BT Communications
Ireland Group Limited – UK
Branch
b
100% –
Company name
Group
interest in
allotted
capital
a
Share class
BT Cornwall Limited 100% ordinary
BT Corporate Trustee
Limited 100%
limited by
guarantee
BT European Investments
Limited 100% ordinary
BT Facilities Services
Limited 100% ordinary
BT Fifty-One 100% ordinary
BT Fifty-Three Limited 100% ordinary
BT Fleet Limited 100% ordinary
BT Global Security Services
Limited 100% ordinary
BT Global Services Limited 100% ordinary
BT Holdings Limited 100% ordinary
BT IoT Networks Limited 100% ordinary
BT Lancashire Services
Limited 100% ordinary
BT Law Limited 100% ordinary
BT LGS Limited 100% ordinary
BT Limited 100% ordinary
BT Managed Services
(No.2) Limited 100% ordinary
BT Managed Services
Limited 100% ordinary
BT Nominees Limited 100% ordinary
BT Property Holdings
(Aberdeen) Limited 100% ordinary
BT Property Limited 100% ordinary
BT Sixty-Four Limited 100% ordinary
BT SLE Euro Limited 100% ordinary
BT SLE USD Limited 100% ordinary
BT Solutions Limited 100% ordinary
BT South Tyneside Limited 100% ordinary
BT UAE Limited 100% ordinary
Communications Global
Network Services Limited
– UK Branch
b
100% –
Communications
Networking Services (UK) 100% ordinary
Communicator (IOM)
Limited – UK Branch
b
100% –
ESAT Telecommunications
(UK) Limited 100% ordinary
Extraclick Limited 100% ordinary
groupBT Limited 100% ordinary
Newgate Street
Secretaries Limited 100% ordinary
Numberrapid Limited 100% ordinary
Pelipod Ltd 100% ordinary
Radianz Limited 100% ordinary
SEV Automotive And Plant
Limited 100% ordinary
Company name
Group
interest in
allotted
capital
a
Share class
Southgate Developments
Limited 100% ordinary
Tikit Limited 100% ordinary
Tudor Minstrel 100% ordinary
Alexander Bain House, 15 York Street,
Glasgow, G2 8LA Scotland
Holland House (Northern)
Limited 100% ordinary
BDO LLP, 55 Baker Street, London, W1U 7EU,
United Kingdom
BT Business Direct Limited 100% ordinary
BT Fifty 100% ordinary
BT Forty-Nine 100% ordinary
BT IT Services Limited 100% ordinary
BT Lease Holdings Limited 100% ordinary
BT Leasing Limited 100% ordinary
BT Moorgate One Limited 100% ordinary
BT Moorgate Two Limited 100% ordinary
BT Property Holdings
(Oxford) Limited 100% ordinary
BT Seventy-Three 100% ordinary
BTexact Technologies
Limited 100% ordinary
BTexact Venturing Limited 100% ordinary
dabs.com Limited 100% ordinary
IP Trade Networks Ltd 100% ordinary
Mobilise Telecoms Limited 100% ordinary
M-Viron Limited 100% ordinary
Newgate Leasing Limited 100% ordinary
Postgate Holding
Company 100% ordinary
Kelvin House, 123 Judd Street, London, WC1H
9NP, United Kingdom
Openreach Limited 100% ordinary
The Balance, 2 Pinfold Street, Sheeld,
S1 2GU, United Kingdom
Plusnet plc 100% ordinary
Third Floor, St Georges Court, Upper Church
Street, Douglas, IM1 1EE, Isle of Man
Belmullet Limited 100% ordinary
Communicator Insurance
Company Limited 99% ordinary
1% preference
Communicator Limited 100% ordinary
Priestgate Limited 100% ordinary

183
BT Group plc Annual Report 2019 Strategic report
Governance
Financial statements
Additional information
Company name
Group
interest in
allotted
capital
a
Share class
Trident Place, Mosquito Way, Hateld,
Hertfordshire, AL10 9BW, United Kingdom
EE (Group) Limited 100% ordinary
EE Finance Limited 100% ordinary
EE Limited 100% ordinary
EE Pension Trustee
Limited 100% ordinary
EE Services Limited 100% ordinary
Everthing Everywhere
Limited 100% ordinary
Mainline Communications
Group Limited 100% ordinary
Mainline Digital
Communications Limited 100% ordinary
Orange Furbs Trustees
Limited 100% ordinary
Orange Home UK Limited 100% ordinary
Orange Personal
Communications Services
Limited 100% ordinary
United States
c/o Corporation Service Company, 2215-B
Renaissance Drive, Las Vegas, NV 89119,
United States
BT LatAm (Nevada) Corp. 100% common
c/o Corporation Service Company, 251 Little
Falls Drive, Wilmington DE 19808, United
States
BT Americas Holdings Inc. 100% common
BT Americas Inc. 100% common
BT Communications Sales
LLC 100% units
BT Conferencing Video Inc. 100% common
BT Federal Inc. 100% common
BT LatAm Holdings One,
Inc. 100% common
BT LatAm Holdings Three,
Inc. 100% common
BT LatAm Holdings Two,
Inc. 100% common
BT LatAm Services, Inc. 100% common
BT LatAm, Inc. 100% common
BT Procure L.L.C. 100% units
BT United States L.L.C. 100% units
Infonet Services
Corporation 100% common
IP Trade Network Corp 100% common
Radianz Americas Inc. 100% common
Company name
Group
interest in
allotted
capital
a
Share class
Uruguay
Rincón 487 Piso 11, Montevideo, ZIP CODE
11.000, Uruguay
BT Solutions Limited
Sucursal Uruguay
b
100% –
Venezuela
Edicio Parque Cristal, Torre Oeste, Piso 5, Ocina
5, Avenida Francisco de Miranda, Urbanización Los
Palos Grandes, Caracas 1060, Venezuela
BT LatAm Venezuela, S.A. 100% ordinary
BT Global (Venezuela) S.A. 100% ordinary
Vietnam
16th Floor, Saigon Tower, 29 Le Duan Road,
District 1 Ho Chi Minh City, Socialist Republic
of Vietnam
BT (Vietnam) Co. Ltd. 100% ordinary
7th Floor, ESTAR Building, 147-149 Vo Van Tan
Street, Ward 6, District 3, HCM City, Vietnam
Sun Vietnam Co., Ltd. 60% ordinary
Zambia
Plot No. 4015A, Frost Building, Gallery Oce
Park, Lagos Road, Rhodespark, Lusaka, Lusaka
Province, Zambia
BT Solutions Limited
b
100% –
Zimbabwe
3 Baines Avenue, Box 334, Harare, Zimbabwe
Numberrapid Limited
b
100% –

184
BT Group plc Annual Report 2019
Related undertakings continued
Associates
Company name
Group
interest in
allotted
capital
a
Share class
Held via other group companies
British Virgin Islands
Craigmuir Chambers, PO Box 71, Road Town,
Tortora, British Virgin Islands
Ecquaria Limited 50% ordinary
Italy
Piazzale Luigi Sturzo, 23, 00144, Roma, Italy
QXN S.c.p.A. 25% ordinary
Via XII Ottobre 2N, 16121, Genova, Liguria,
Italy
I2 S.r.l 23% –
Mauritius
IFS Court, Bank Street, TwentyEight
Cybercity, Ebene, 72201, Mauritius
Mahindra – BT
Investment Company
(Mauritius) Limited 43% ordinary
Philippines
32F Philam Life Tower, 8767 Paseo de Roxas,
Makati City, Philippines
ePLDTSunphilcox JV, Inc 20% ordinary
SunPhilcox JV, Inc 20% ordinary
Saudi Arabia
New Acaria Commercial Complex, Al-Siteen
Street, Malaz, Riyadh, Saudi Arabia
British Telecom Al-Saudia
Limited 49% other
United Kingdom
24/25 The Shard, 32 London Bridge Street,
London, SE1 9SG, United Kingdom
Digital Mobile Spectrum
Limited 25% ordinary
Unit 1, Colwick Quays Business Park, Colwick,
Nottingham, Nottinghamshire, NG4 2JY,
United Kingdom
Midland Communications
Distribution Limited 35% ordinary
Joint Ventures and Joint Operations
c
Company name
Group
interest in
allotted
capital
a
Share class
Held via other group companies
United Kingdom
Sixth Floor, Thames Tower, Station Road,
Reading, RG1 1LX, United Kingdom
Mobile Broadband
Network Limited 50% ordinary
6th Floor, One London Wall, London, EC2Y
5EB, United Kingdom
Internet Matters Limited 25% –
81 Newgate Street, London, EC1A 7AJ,
United Kingdom
BT OnePhone Limited 70% ordinary
St Helen’s 1 Undershaft, London, EC3P 3DQ,
United Kingdom
Rugby Radio Station
(General Partner) Limited 50% ordinary
Rugby Radio Station
(Nominee) Limited 50% ordinary
Rugby Radio Station LP 50% –
10 Lower Thames Street, Third Floor,
London, EC3R 6YT, United Kingdom
Youview TV Limited 14% voting
Interests in joint operations
EE Limited and Hutchison 3G UK Limited
(together ‘the Companies’) each have a
50% share in the joint operation Mobile
Broadband Network Limited (‘MBNL’).
MBNL’s ongoing purpose is the operation
and maintenance of mobile networks
through a sharing arrangement. This
includes the ecient management of shared
infrastructure and networks on behalf of
the Companies, acquiring certain network
elements for shared use, and coordinating
the deployment of new infrastructure and
networks on either a shared or a unilateral
basis (unilateral elements being network
assets or services specic to one company
only). The group is committed to incurring
50% of costs in respect of restructuring
the Shared Network, a similar proportion
of the operating costs (which varies in line
with usage), and 100% of any unilateral
elements.
Guarantees for the joint operation are given
by British Telecommunications plc and
CK Hutchison Holdings Limited.
The principal place of business of the joint
operation is in the UK.
a
The proportion of voting rights held corresponds to the aggregate
interest in percentage held by the holding company and
subsidiaries undertaking.
b
No shares issued for a branch.
c
All joint ventures are governed by a joint venture agreement
or shareholder agreement. MBNL is accounted for as a joint
operation.

BT Group plc Annual Report 2019
185
Strategic report
Governance
Financial statements
Additional information
Additional information
Alternative performance measures
Introduction
We assess the performance of the group using a variety of
alternative performance measures that are not defined under
IFRS and are therefore termed non-GAAP measures. The
non-GAAP measures we use are: change in underlying revenue,
adjusted revenue, adjusted EBITDA, adjusted earnings per share,
normalised free cash flow, and net debt. The rationale for using
these measures, along with a reconciliation from the nearest
measures prepared in accordance with IFRS, are presented in this
Additional Information below.
The alternative performance measures we use may not be directly
comparable with similarly titled measures used by other
companies.
Specific items
The group’s income statement and segmental analysis separately
identify trading results on an adjusted basis, being before specific
items. The directors believe that presentation of the group’s
results in this way is relevant to an understanding of the group’s
financial performance as specific items are those that in
management’s judgement need to be disclosed by virtue of their
size, nature or incidence. This is consistent with the way that
financial performance is measured by management and reported
to the Board and the
Executive Committee
and assists in
providing a meaningful analysis of the trading results of the
group.
In determining whether an event or transaction is specific,
management considers quantitative as well as qualitative factors,
such as the frequency or predictability of occurrence.
Examples of charges or credits meeting the above definition and
which have been presented as specific items in the current and/or
prior years include acquisitions/disposals of businesses and
investments, retrospective regulatory matters, historical
insurance or litigation claims, business restructuring programmes,
asset impairment charges, property rationalisation programmes,
net interest on pensions and the settlement of multiple tax years.
In the event that items meet the criteria, which are applied
consistently from year to year, they are treated as specific items.
Reported revenue, reported operating costs, reported operating
profit, reported profit before tax, reported net finance expense
and reported EPS are the equivalent IFRS measures. A
reconciliation from these can be seen in the Group income
statement on page 110.
Change in underlying revenue
Change in underlying revenue is a non-GAAP measure that seeks
to reflect the underlying performance of the group that will
contribute to long-term sustainable growth. As such this excludes
the impact of acquisitions or disposals, foreign exchange
movements and specific items.
We have also separately included IFRS 15 in the current year to
identify the impact of the new revenue standard which was
effective from 1 April 2018. This is important to understand the
movement in revenue year on year as comparatives for prior years
are reported under the previous standard (IAS 18).
A reconciliation from the movement in reported revenue, the
most directly comparable IFRS measures, to the movement in
underlying revenue, is set out below.
Year ended 31 March
2019
%
2018
%
Decrease in reported revenue (IAS 18) (1.2) (1.4)
Specific items (IAS 18) – –
IFRS 15 adjustment (0.1) –
Decrease in adjusted revenue (IFRS 15 pro forma) (1.3) (1.4)
Transit revenue – 0.6
Acquisitions and disposals 0.2 0.1
Foreign exchange movements 0.2 (0.3)
Decrease in underlying revenue (0.9) (1.0)
Adjusted EBITDA
In addition to measuring financial performance of the group and
customer-facing units based on operating profit, we also measure
performance based on EBITDA and adjusted EBITDA. EBITDA is
defined as the group profit or loss before interest, taxation,
depreciation and amortisation. Adjusted EBITDA is defined as
EBITDA before specific items, net non-interest related finance
expense, and share of profits or losses of associates and joint
ventures. EBITDA is a common measure used by investors and
analysts to evaluate the operating financial performance of
companies, particularly in the telecommunications sector.
We consider EBITDA and adjusted EBITDA to be useful measures
of our operating performance because they approximate the
underlying operating cash flow by eliminating depreciation and
amortisation. EBITDA and adjusted EBITDA are not direct
measures of our liquidity, which is shown by our cash flow
statement, and need to be considered in the context of our
financial commitments.
A reconciliation of reported profit for the period, the most directly
comparable IFRS measure, to EBITDA and adjusted EBITDA is set
out below.
Year ended 31 March
2019
£m
2018
£m
2017
£m
Reported profit for the period 2,159 2,032 1,908
Tax 507 584 446
Reported profit before tax 2,666 2,616 2,354
Net interest related finance expense 606 530 580
Depreciation and amortisation 3,546 3,514 3,572
EBITDA 6,818 6,660 6,506
EBITDA specific items
a
425 610 906
Net other finance expense 150 234 224
Share of post tax losses (profits) of
associates and joint ventures (1) 1 9
Adjusted EBITDA 7,392 7,505 7,645
a
Excludes amortisation specifics of £nil (2017/18: £nil, 2016/17: £62m). Specific items are set
out in note 10 to the consolidated financial statements.

186
BT Group plc Annual Report 2019
Additional information continued
Alternative performance measures continued
Earnings per share
We also measure financial performance based on adjusted earnings per share, which excludes specific items. Basic and adjusted earnings
per share, and the per share impact of specific items, are as follows:
2019 2018 2017
Year ended 31 March
Pence
per share £m
Pence
per share £m
Pence
per share £m
Basic earnings per share/profit 21.8 2,159 20.5 2,032 19.2 1,908
Specific items
a
4.5 452 7.4 741 9.7 961
Adjusted basic earnings per share/profit 26.3 2,611 27.9 2,773 28.9 2,869
a
Specific items are set out in note 10 to the consolidated financial statements.
We disclose reported earnings per share, both basic and diluted, in note 12 to the consolidated financial statements.
Normalised free cash flow
Normalised free cash flow is one of the group’s key performance indicators by which our financial performance is measured. It is
primarily a liquidity measure. However, we also believe it is an important indicator of our overall operational performance as it reflects
the cash we generate from operations after capital expenditure and financing costs, both of which are significant ongoing cash outflows
associated with investing in our infrastructure and financing our operations.
Normalised free cash flow is defined as free cash flow (net cash inflow from operating after capital expenditure) after net interest paid,
before pension deficit payments (including the cash tax benefit of pension deficit payments) and specific items. It excludes cash flows
that are determined at a corporate level independently of ongoing trading operations such as dividends, share buybacks, acquisitions
and disposals, and repayment and raising of debt.
Normalised free cash flow is not a measure of the funds that are available for distribution to shareholders.
A reconciliation from cash inflow from operating activities, the most directly comparable IFRS measure, to free cash flow and normalised
free cash flow, is set out below.
Year ended 31 March
2019
£m
2018
£m
2017
£m
Cash generated from operations 4,687 5,400 6,725
Tax paid (431) (473) (551)
Net cash inflow from operating activities 4,256 4,927 6,174
Net purchase of property, plant and equipment and software (3,637) (3,341) (3,119)
Free cash flow 619 1,586 3,055
Interest received 23 7 7
Interest paid (531) (555) (629)
Add back pension deficit payments 2,024 872 274
Add back net cash flow from specific items 598 828 205
Add back net sale of non-current asset investments 1 19 (20)
Add back payments in respect of acquisition of spectrum licences – 325 –
Remove refund on acquisition of spectrum licence (21) – –
Remove cash tax benefit of pension deficit payments (273) (109) (110)
Normalised free cash flow 2,440 2,973 2,782
Net debt
Net debt consists of loans and other borrowings (both current and non-current), less current asset investments and cash and cash
equivalents. Loans and other borrowings are measured as the net proceeds raised, adjusted to amortise any discount over the term of
the debt. For the purpose of this measure, current asset investments and cash and cash equivalents are measured at the lower of cost
and net realisable value.
Our net debt calculation starts from the expected future undiscounted cash flows that should arise when our financial instruments
mature. We adjust these cash flows to reflect hedged risks that are re-measured under fair value hedges, as well as for the impact of
the effective interest method. Currency-denominated balances within net debt are translated to sterling at swap rates where hedged.
Net debt is a measure of the group’s net indebtedness that provides an indicator of overall balance sheet strength. It is also a single
measure that can be used to assess both the group’s cash position and its indebtedness. The use of the term ‘net debt’ does not
necessarily mean that the cash included in the net debt calculation is available to settle the liabilities included in this measure.

BT Group plc Annual Report 2019
187
Strategic report
Governance
Financial statements
Additional information
Alternative performance measures continued
Net debt is considered to be an alternative performance measure as it is not defined in IFRS. A reconciliation from loans and other
borrowings, cash and cash equivalents, and current asset investments, the most directly comparable IFRS measures to net debt, is
set out below.
At 31 March
2019
£m
2018
£m
2017
£m
Loans and other borrowings
a
16,876 14,275 12,713
Cash and cash equivalents (1,666) (528) (528)
Current investments (3,214) (3,022) (1,520)
11,996 10,725 10,665
Adjustments:
To retranslate currency denominated balances at swapped rates where hedged
b
(701) (874) (1,419)
To remove fair value adjustments and accrued interest applied to reflect the effective interest method
c
(260) (224) (314)
Net debt 11,035 9,627 8,932
a
Includes overdrafts of £72m at 31 March 2019 (31 March 2018: £29m, 31 March 2017: £17m).
b
The translation difference between spot rate and hedged rate of loans and borrowings denominated in foreign currency.
c
Includes remaining fair value adjustments made on certain loans and other borrowings and accrued interest at the balance sheet date.

188
BT Group plc Annual Report 2019
Selected financial data
Summary group income statement
Year ended 31 March
2019
£m
2018
£m
2017
£m
2016
£m
2015
£m
Revenue
Adjusted 23,459 23,746 24,082 18,879 17,840
Specific items (31) (23) (20) 133 128
23,428 23,723 24,062 19,012 17,968
Operating costs
Adjusted (19,613) (19,755) (19,947) (15,051) (14,185)
Specific items (394) (587) (948) (348) (381)
(20,007) (20,342) (20,895) (15,399) (14,566)
Operating profit
Adjusted 3,846 3,991 4,135 3,828 3,655
Specific items (425) (610) (968) (215) (253)
3,421 3,381 3,167 3,613 3,402
Net finance expense
Adjusted (617) (546) (594) (483) (560)
Specific items (139) (218) (210) (229) (299)
(756) (764) (804) (712) (859)
Share of post tax (loss) profit of associates and joint ventures
Adjusted 1 (1) (9) 6 (1)
Profit (loss) on disposal of interest in associates and joint ventures – specific items – – – – 25
1 (1) (9) 6 24
Profit before taxation
Adjusted 3,230 3,444 3,532 3,351 3,094
Specific items (564) (828) (1,178) (444) (527)
2,666 2,616 2,354 2,907 2,567
Taxation expense
Adjusted (619) (671) (663) (607) (631)
Specific items 112 87 217 166 121
(507) (584) (446) (441) (510)
Profit for the year
Adjusted 2,611 2,773 2,869 2,744 2,463
Specific items (452) (741) (961) (278) (406)
2,159 2,032 1,908 2,466 2,057
Basic earnings per share
Adjusted 26.3p 27.9p 28.9p 31.8p 30.6p
Specific items (4.5)p (7.4)p (9.7)p (3.3)p (5.1)p
21.8p 20.5p 19.2p 28.5p 25.5p
Average number of shares used in basic earnings per share (millions) 9,912 9,911 9,938 8,619 8,056
Average number of shares used in diluted earnings per share (millions) 9,975 9,961 9,994 8,714 8,191
Diluted earnings per share 21.6p 20.4p 19.1p 28.2p 25.1p
Dividends per share
a
15.4p 15.4p 15.4p 14.0p 12.4p
Dividends per share, US cents
a,b
20.1c 21.6c 19.3c 20.1c 18.4c
a
Dividends per share represents the dividend paid and proposed in respect of the relevant financial year. Under IFRS, interim dividends are recognised as a deduction from shareholders’ equity when they
are paid, final dividends when they are approved.
b
Based on actual dividends paid and/or year end exchange rate on proposed dividends.
Additional information continued

BT Group plc Annual Report 2019
189
Strategic report
Governance
Financial statements
Additional information
Selected financial data continued
Summary group balance sheet
At 31 March
2019
£m
2018
(Restated)
a
£m
2017
£m
2016
£m
2015
£m
Intangible assets 14,385 14,447 15,029 15,450 3,170
Property, plant and equipment 17,835 17,000 16,498 15,971 13,498
Other non-current assets 3,623 3,046 3,970 2,997 3,040
Total non-current assets 35,843 34,493 35,497 34,418 19,708
Current assets less current liabilities 842 (1,836) (4,050) (3,103) (356)
Total assets less current liabilities 36,685 32,657 31,447 31,315 19,352
Non-current loans and other borrowings (14,776) (11,994) (10,081) (11,025) (7,862)
Retirement benefit obligations (7,182) (6,847) (9,088) (6,382) (7,583)
Other non-current liabilities (4,560) (3,905) (3,943) (3,796) (3,226)
Total assets less liabilities 10,167 9,911 8,335 10,112 681
Ordinary shares 499 499 499 499 419
Share premium account 1,051 1,051 1,051 1,051 1,051
Own shares (167) (186) (96) (115) (165)
Merger reserve 4,147 6,647 6,647 8,422 998
Other reserves 718 534 884 685 502
Retained loss 3,919 1,366 (650) (430) (2,124)
Total equity 10,167 9,911 8,335 10,112 681
a
Certain results have been restated to reflect the update to the calculation of our IAS19 accounting valuation of retirement benefit obligations. See note 2 to the Condensed consoliated financial
statements.

190
BT Group plc Annual Report 2019
Cautionary statement regarding forward-looking statements
This Annual Report contains certain forward-looking statements
which are made in reliance on the safe harbour provisions of
the US Private Securities Litigation Reform Act of 1995. These
statements relate to analyses and other information which are
based on forecasts of future results and estimates of amounts not
yet determinable. These statements include, without limitation,
those concerning: current and future years’ outlook; underlying
revenue and revenue trends; EBITDA; free cash ow; capital
expenditure; shareholder returns including dividends and share
buyback; net debt; credit ratings; our group-wide transformation
and restructuring programme, cost transformation plans and
restructuring costs; investment in and roll out of our bre network
and its reach, innovations, increased speeds and speed availability;
our broadband-based service and strategy; investment in and
rollout of 5G; our investment in TV, enhancing our TV service and
BT Sport; the investment in converged network; the recovery
plan, operating charge, regular cash contributions and interest
expense for our dened benet pension schemes; eective tax
rate; growth opportunities in networked IT services, the pay-TV
services market, broadband, articial intelligence and mobility
and future voice; growth of, and opportunities available in, the
communications industry and BT’s positioning to take advantage of
those opportunities; expectations regarding competition, market
shares, prices and growth; expectations regarding the convergence
of technologies; plans for the launch of new products and services;
network performance and quality; the impact of regulatory
initiatives, decisions and outcomes on operations, including the
regulation of the UK xed wholesale and retail businesses and
the impact of the Commitments we gave to Ofcom to provide
Openreach with greater strategic and operational independence
following Ofcom’s Digital Communications Review; BT’s possible or
assumed future results of operations and/or those of its associates
and joint ventures; investment plans; adequacy of capital; nancing
plans and renancing requirements; demand for and access
to broadband and the promotion of broadband by third-party
service providers; improvements to the control environment; and
those statements preceded by, followed by, or that include the
words ‘aims’, ‘believes’, ‘expects’, ‘anticipates’, ‘intends’, ‘will’,
‘should’,‘plans’, ‘strategy’, ‘future’, ‘likely’, ‘seeks’, ‘projects’,
‘estimates’ or similar expressions.
Although BT believes that the expectations reected in these
forward-looking statements are reasonable, it can give no
assurance that these expectations will prove to have been correct.
Because these statements involve risks and uncertainties, actual
results may dier materially from those expressed or implied
by these forward-looking statements. Factors that could cause
dierences between actual results and those implied by the
forward-looking statements include, but are not limited to:
market disruptions caused by technological change and/or
intensifying competition from established players or new market
entrants; unfavourable changes to our business where Ofcom
raises competition concerns around market power; unfavourable
regulatory changes; disruption to our business caused by an
uncertain or adversarial political environment; geopolitical risks;
adverse developments in respect of our dened benet pension
schemes; adverse changes in economic conditions in the markets
served by BT, including interest rate risk, foreign exchange risk,
credit risk, liquidity risk and tax risk; nancial controls that may not
prevent or detect fraud, nancial misstatement or other nancial
loss; security breaches relating to our customers’ and employees’
data or breaches of data privacy laws; failures in the protection
of the health, safety and wellbeing of our people or members of
the public or breaches of health and safety law and regulations;
controls and procedures that could fail to detect unethical or
inappropriate behaviour by our people or associates; customer
experiences that are not brand enhancing nor drive sustainable
protable revenue growth; failure to deliver, and other operational
failures, with regard to our complex and high-value national and
multinational customer contracts; changes to our customers’ needs
or businesses that adversely aect our ability to meet contractual
commitments or realise expected revenues, protability or cash
ow; termination of customer contracts; natural perils, network
and system faults or malicious acts that could cause disruptions
or otherwise damage our network; supply chain failure, software
changes, equipment faults, re, ood, infrastructure outages
or sabotage that could interrupt our services; attacks on our
infrastructure and assets by people inside BT or by external sources
like hacktivists, criminals, terrorists or nation states; disruptions
to the integrity and continuity of our supply chain (including any
impact of global political developments with respect to Huawei);
insucient engagement from our people; and risks relating to our
BT transformation plan. Certain of these factors are discussed in
more detail elsewhere in this Annual Report including, without
limitation, in Our approach to risk management on pages 44 to
54. BT undertakes no obligation to update any forward-looking
statements whether written or oral that may be made from time
to time, whether as a result of new information, future events or
otherwise.
Material contracts
Excluding contracts entered into in the ordinary course of business,
no contracts have been entered into in the two years preceding the
date of this document by BT or another member of the group which
are, or may be, material to the group or contain a provision under
which a member of the group has an obligation or entitlement
which is, or may be, material to BT or such other member of the
group.
Additional information continued

Notes

Notes

BT Group plc
Registered office: 81 Newgate Street, London EC1A 7AJ
Registered in England and Wales No. 4190816
Produced by BT Group
PHME 84339
Printed in England by Pindar Scarborough Ltd
Design by emperor.works
Typeset by Donnelley Financial Solutions
Printed on Revive 50 Silk which is made from 50%
de-inked, post-consumer waste and 50% virgin fibre
bt.com
Please recycle
BT Group plc Annual Report 2019
